A timed R challenge cleaning and visualizing FiveThirtyEight’s Star Wars fan survey.
R
Timed Challenge
Survey Data
Author
Spencer Payne
Show the code
#load your libraries in this chunklibrary(tidyverse)dat_multi <-read_csv("https://github.com/byuidatascience/data_fivethirtyeight_starwars/raw/master/survey_multiresponse_questions.csv")dat_single <-read_csv("https://github.com/byuidatascience/data_fivethirtyeight_starwars/raw/master/survey_oneresponse_questions.csv")dat_wide <-read_csv("https://github.com/byuidatascience/data_fivethirtyeight_starwars/raw/master/survey_wide_all.csv")
The challenge
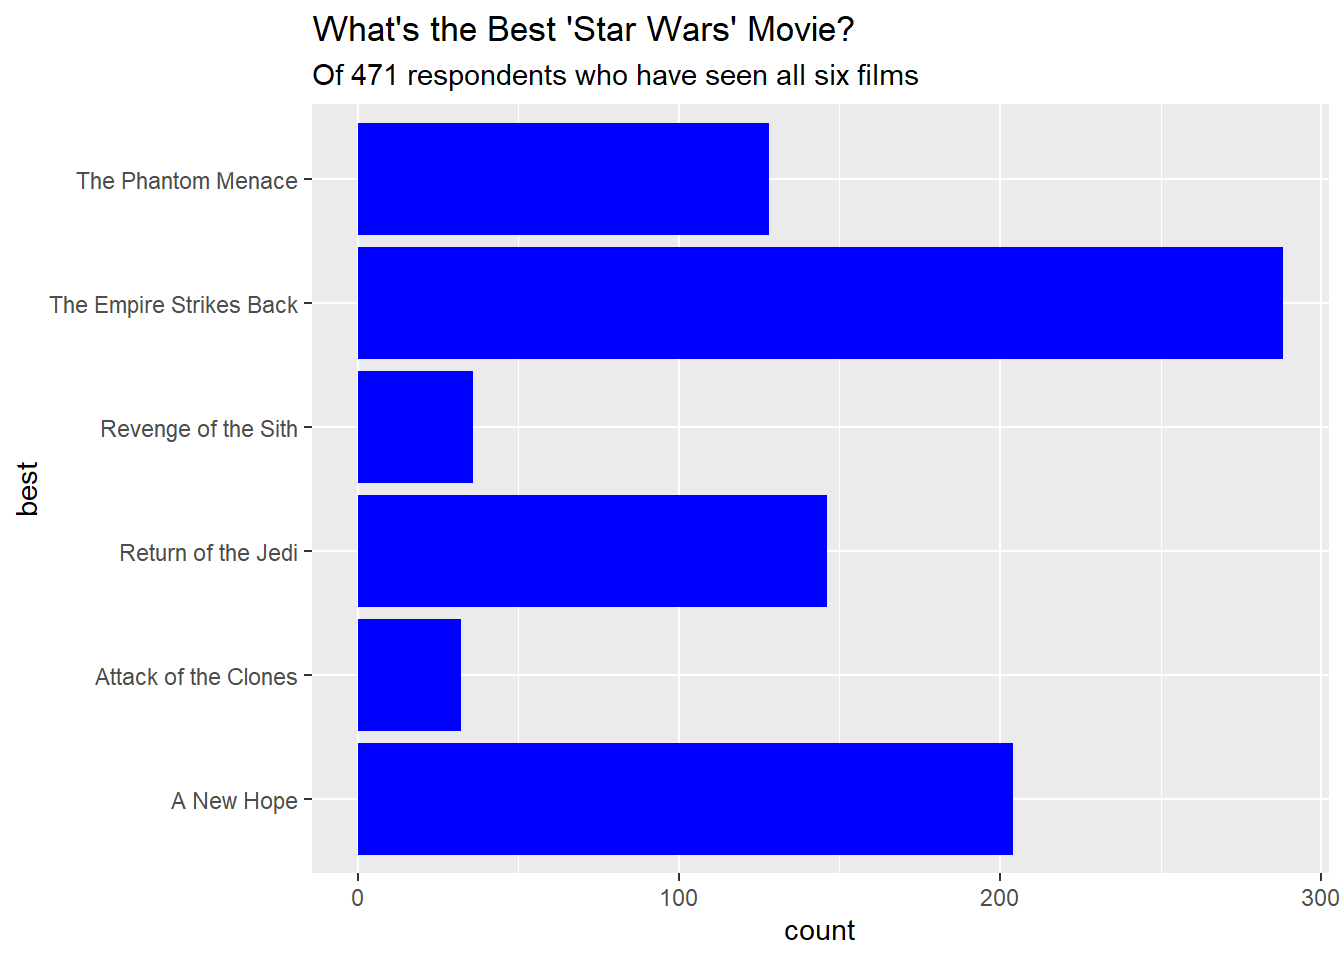
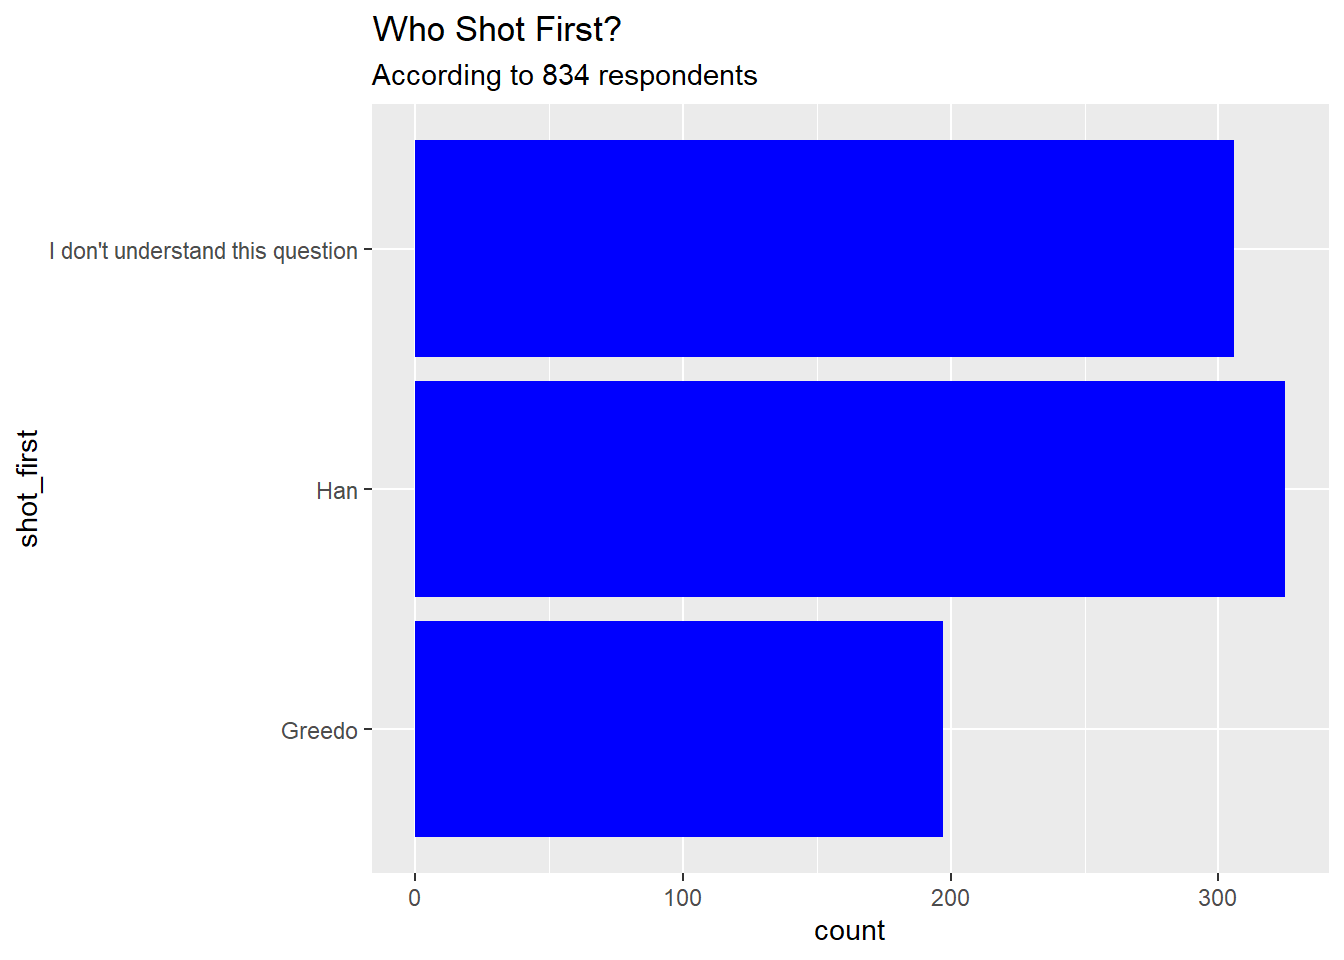
In a timed coding challenge, I had to clean FiveThirtyEight’s Star Wars fan survey and recreate two charts from their article. The survey ships as three messy files: multi-response questions, single-response questions, and a wide table with long, machine-generated column names. The work was to rename and select the useful fields, filter to respondents who had seen all six films, derive each person’s favorite film from their rankings, and rebuild the published charts.
best <- wide %>%mutate(best =case_when( E1_Rank ==1~"The Phantom Menace", E2_Rank ==1~"Attack of the Clones", E3_Rank ==1~"Revenge of the Sith", E4_Rank ==1~"A New Hope", E5_Rank ==1~"The Empire Strikes Back", E6_Rank ==1~"Return of the Jedi"))
Recreated charts
Show the code
ggplot(best, mapping =aes(best))+geom_bar(fill ="blue")+coord_flip()+labs(title ="What's the Best 'Star Wars' Movie?",subtitle ="Of 471 respondents who have seen all six films")