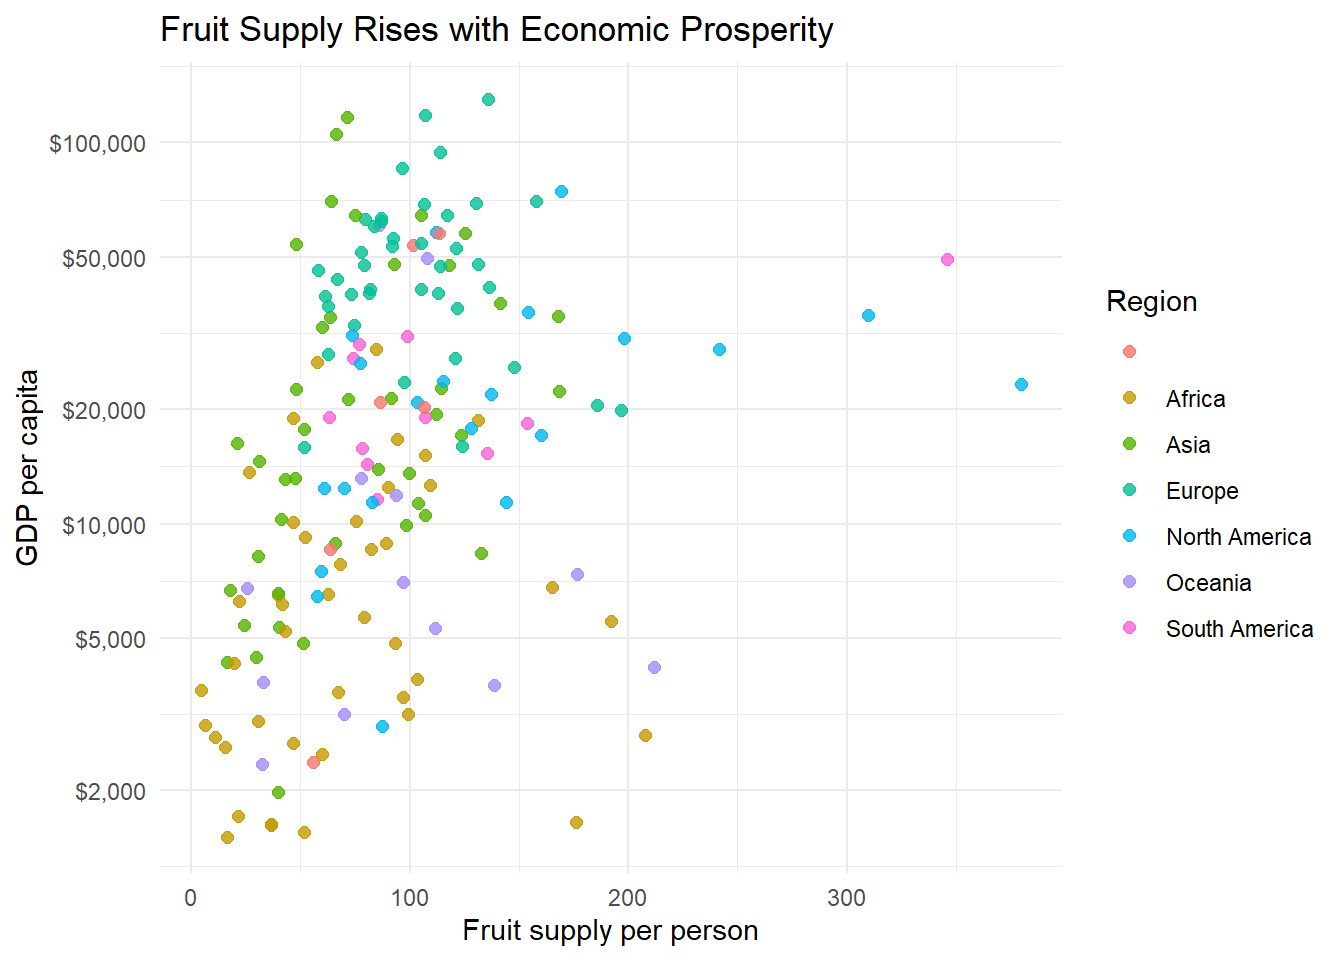
Fruit Supply and Economic Prosperity
DS 350 · Data Wrangling & Visualization
R
ggplot2
Visual Highlighting
Used highlighting to tell a focused story in Our World in Data’s fruit supply vs. GDP per capita data.
Visual reports written for a specific audience. They use highlighting, maps, and small multiples so the main message is obvious at a glance.