Show the code
library(tidyverse)
library(jsonlite)
library(scales)
library(ggrepel)Our World in Data publishes fruit supply per person alongside GDP per capita for nearly every country. A chart with every country is hard to read, so I used highlighting to tell one story at a time: the overall trend, a handful of selected countries, and then Asia on its own.
library(tidyverse)
library(jsonlite)
library(scales)
library(ggrepel)library(jsonlite)
# Fetch the data
df <- read.csv("https://ourworldindata.org/grapher/fruit-consumption-vs-gdp-per-capita.csv?v=1&csvType=filtered&useColumnShortNames=true")fruit <- df %>%
rename(Country = entity,
Region = owid_region,
GDP = ny_gdp_pcap_pp_kd,
Fruit_kg = fruit__00002919__food_available_for_consumption__0645pc__kilograms_per_year_per_capita) %>%
drop_na(Country, Region, GDP, Fruit_kg) %>%
filter(GDP > 0, Fruit_kg >= 0)ggplot(fruit, aes(x = Fruit_kg, y = GDP, color = Region)) +
geom_point(size = 2, alpha = 0.8) +
scale_x_continuous(breaks = seq(0, 400, by = 100)) +
scale_y_log10(breaks = c( 1000, 2000, 5000, 10000, 20000, 50000, 100000),
labels = label_dollar(accuracy = 1, big.mark = ",")) +
labs(title = "Fruit Supply Rises with Economic Prosperity",
x = "Fruit supply per person",
y = "GDP per capita",
color = "Region") +
theme_minimal()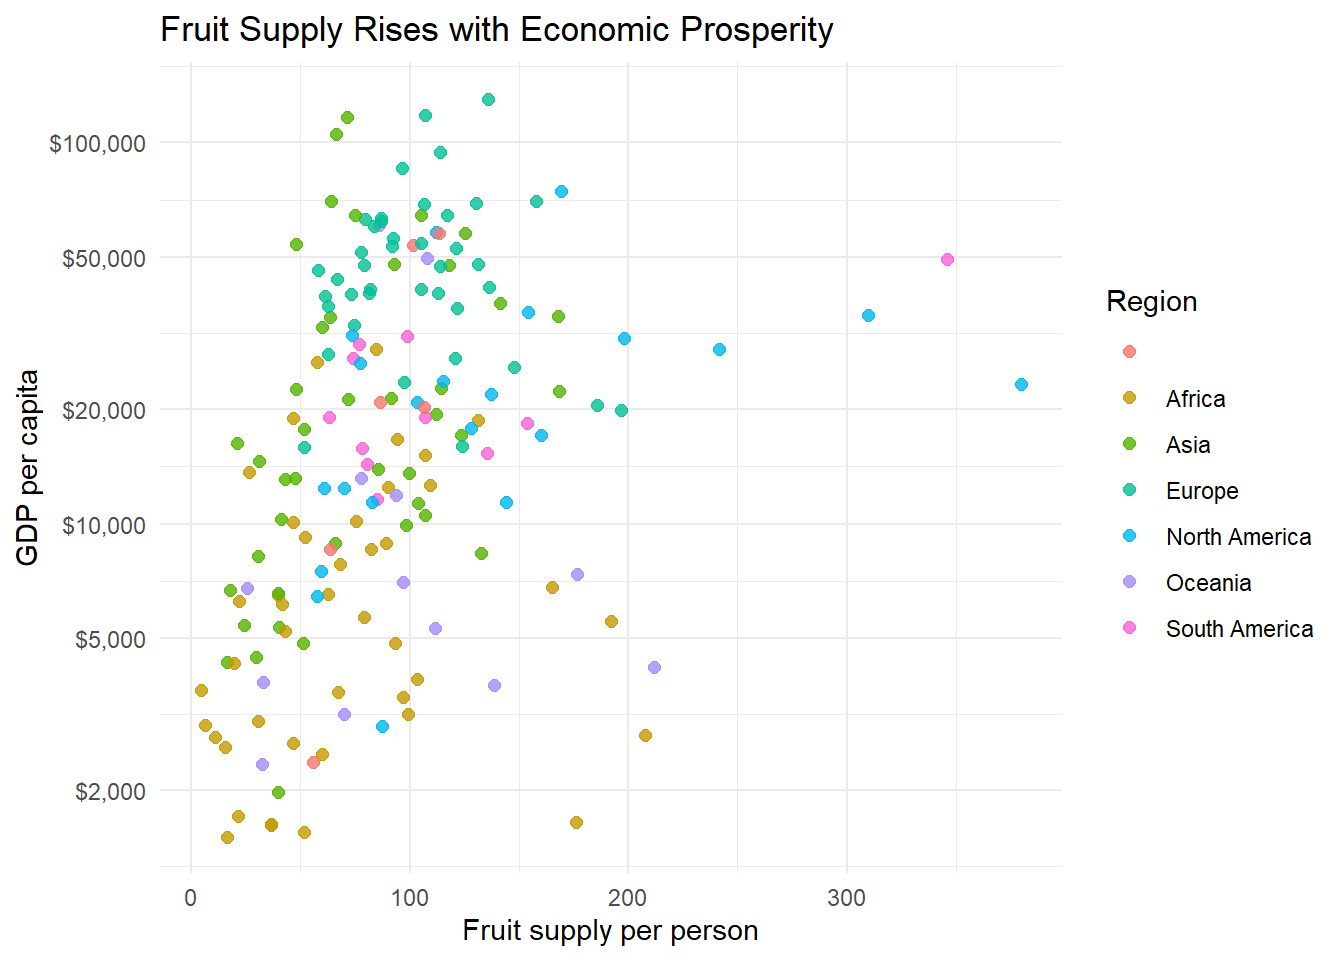
chosen_countries <- fruit %>%
filter(Country %in% c( "Egypt", "Costa Rica", "South Korea", "United States"))ggplot(fruit, aes(x = Fruit_kg, y = GDP)) +
geom_point(color = "gray", size = 1.8, alpha = 0.5) +
geom_point(data = chosen_countries, aes(color = Region), size = 4) +
geom_text_repel(data = chosen_countries, aes(label = Country, color = Region),
size = 4, fontface = "bold", show.legend = FALSE) +
scale_x_continuous(breaks = seq(0, 400, by = 100),
labels = label_number(suffix = " kg"),
limits = c(0, 400)) +
scale_y_log10(breaks = c( 1000, 2000, 5000, 10000, 20000, 50000, 100000),
labels = label_dollar(accuracy = 1, big.mark = ",")) +
labs(title = "Fruit Supply and Income in Four Selected Countries",
x = "Fruit supply per person",
y = "GDP per capita",
color = "Region")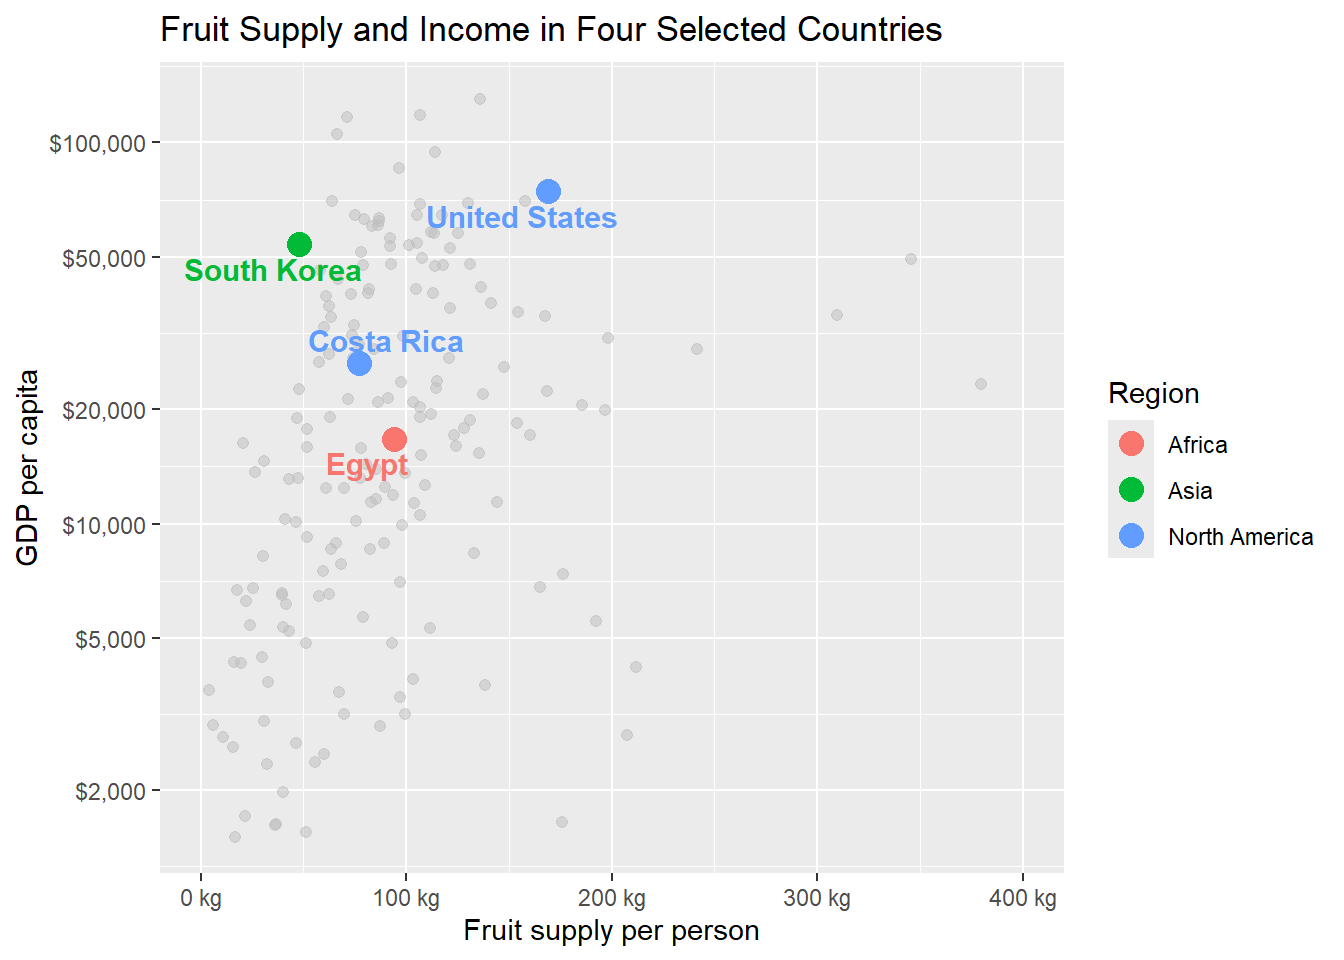
theme_minimal()<theme> List of 144
$ line : <ggplot2::element_line>
..@ colour : chr "black"
..@ linewidth : num 0.5
..@ linetype : num 1
..@ lineend : chr "butt"
..@ linejoin : chr "round"
..@ arrow : logi FALSE
..@ arrow.fill : chr "black"
..@ inherit.blank: logi TRUE
$ rect : <ggplot2::element_rect>
..@ fill : chr "white"
..@ colour : chr "black"
..@ linewidth : num 0.5
..@ linetype : num 1
..@ linejoin : chr "round"
..@ inherit.blank: logi TRUE
$ text : <ggplot2::element_text>
..@ family : chr ""
..@ face : chr "plain"
..@ italic : chr NA
..@ fontweight : num NA
..@ fontwidth : num NA
..@ colour : chr "black"
..@ size : num 11
..@ hjust : num 0.5
..@ vjust : num 0.5
..@ angle : num 0
..@ lineheight : num 0.9
..@ margin : <ggplot2::margin> num [1:4] 0 0 0 0
..@ debug : logi FALSE
..@ inherit.blank: logi TRUE
$ title : <ggplot2::element_text>
..@ family : NULL
..@ face : NULL
..@ italic : chr NA
..@ fontweight : num NA
..@ fontwidth : num NA
..@ colour : NULL
..@ size : NULL
..@ hjust : NULL
..@ vjust : NULL
..@ angle : NULL
..@ lineheight : NULL
..@ margin : NULL
..@ debug : NULL
..@ inherit.blank: logi TRUE
$ point : <ggplot2::element_point>
..@ colour : chr "black"
..@ shape : num 19
..@ size : num 1.5
..@ fill : chr "white"
..@ stroke : num 0.5
..@ inherit.blank: logi TRUE
$ polygon : <ggplot2::element_polygon>
..@ fill : chr "white"
..@ colour : chr "black"
..@ linewidth : num 0.5
..@ linetype : num 1
..@ linejoin : chr "round"
..@ inherit.blank: logi TRUE
$ geom : <ggplot2::element_geom>
..@ ink : chr "black"
..@ paper : chr "white"
..@ accent : chr "#3366FF"
..@ linewidth : num 0.5
..@ borderwidth: num 0.5
..@ linetype : int 1
..@ bordertype : int 1
..@ family : chr ""
..@ fontsize : num 3.87
..@ pointsize : num 1.5
..@ pointshape : num 19
..@ colour : NULL
..@ fill : NULL
$ spacing : 'simpleUnit' num 5.5points
..- attr(*, "unit")= int 8
$ margins : <ggplot2::margin> num [1:4] 5.5 5.5 5.5 5.5
$ aspect.ratio : NULL
$ axis.title : NULL
$ axis.title.x : <ggplot2::element_text>
..@ family : NULL
..@ face : NULL
..@ italic : chr NA
..@ fontweight : num NA
..@ fontwidth : num NA
..@ colour : NULL
..@ size : NULL
..@ hjust : NULL
..@ vjust : num 1
..@ angle : NULL
..@ lineheight : NULL
..@ margin : <ggplot2::margin> num [1:4] 2.75 0 0 0
..@ debug : NULL
..@ inherit.blank: logi TRUE
$ axis.title.x.top : <ggplot2::element_text>
..@ family : NULL
..@ face : NULL
..@ italic : chr NA
..@ fontweight : num NA
..@ fontwidth : num NA
..@ colour : NULL
..@ size : NULL
..@ hjust : NULL
..@ vjust : num 0
..@ angle : NULL
..@ lineheight : NULL
..@ margin : <ggplot2::margin> num [1:4] 0 0 2.75 0
..@ debug : NULL
..@ inherit.blank: logi TRUE
$ axis.title.x.bottom : NULL
$ axis.title.y : <ggplot2::element_text>
..@ family : NULL
..@ face : NULL
..@ italic : chr NA
..@ fontweight : num NA
..@ fontwidth : num NA
..@ colour : NULL
..@ size : NULL
..@ hjust : NULL
..@ vjust : num 1
..@ angle : num 90
..@ lineheight : NULL
..@ margin : <ggplot2::margin> num [1:4] 0 2.75 0 0
..@ debug : NULL
..@ inherit.blank: logi TRUE
$ axis.title.y.left : NULL
$ axis.title.y.right : <ggplot2::element_text>
..@ family : NULL
..@ face : NULL
..@ italic : chr NA
..@ fontweight : num NA
..@ fontwidth : num NA
..@ colour : NULL
..@ size : NULL
..@ hjust : NULL
..@ vjust : num 1
..@ angle : num -90
..@ lineheight : NULL
..@ margin : <ggplot2::margin> num [1:4] 0 0 0 2.75
..@ debug : NULL
..@ inherit.blank: logi TRUE
$ axis.text : <ggplot2::element_text>
..@ family : NULL
..@ face : NULL
..@ italic : chr NA
..@ fontweight : num NA
..@ fontwidth : num NA
..@ colour : chr "#4D4D4DFF"
..@ size : 'rel' num 0.8
..@ hjust : NULL
..@ vjust : NULL
..@ angle : NULL
..@ lineheight : NULL
..@ margin : NULL
..@ debug : NULL
..@ inherit.blank: logi TRUE
$ axis.text.x : <ggplot2::element_text>
..@ family : NULL
..@ face : NULL
..@ italic : chr NA
..@ fontweight : num NA
..@ fontwidth : num NA
..@ colour : NULL
..@ size : NULL
..@ hjust : NULL
..@ vjust : num 1
..@ angle : NULL
..@ lineheight : NULL
..@ margin : <ggplot2::margin> num [1:4] 2.2 0 0 0
..@ debug : NULL
..@ inherit.blank: logi TRUE
$ axis.text.x.top : <ggplot2::element_text>
..@ family : NULL
..@ face : NULL
..@ italic : chr NA
..@ fontweight : num NA
..@ fontwidth : num NA
..@ colour : NULL
..@ size : NULL
..@ hjust : NULL
..@ vjust : NULL
..@ angle : NULL
..@ lineheight : NULL
..@ margin : <ggplot2::margin> num [1:4] 0 0 4.95 0
..@ debug : NULL
..@ inherit.blank: logi TRUE
$ axis.text.x.bottom : <ggplot2::element_text>
..@ family : NULL
..@ face : NULL
..@ italic : chr NA
..@ fontweight : num NA
..@ fontwidth : num NA
..@ colour : NULL
..@ size : NULL
..@ hjust : NULL
..@ vjust : NULL
..@ angle : NULL
..@ lineheight : NULL
..@ margin : <ggplot2::margin> num [1:4] 4.95 0 0 0
..@ debug : NULL
..@ inherit.blank: logi TRUE
$ axis.text.y : <ggplot2::element_text>
..@ family : NULL
..@ face : NULL
..@ italic : chr NA
..@ fontweight : num NA
..@ fontwidth : num NA
..@ colour : NULL
..@ size : NULL
..@ hjust : num 1
..@ vjust : NULL
..@ angle : NULL
..@ lineheight : NULL
..@ margin : <ggplot2::margin> num [1:4] 0 2.2 0 0
..@ debug : NULL
..@ inherit.blank: logi TRUE
$ axis.text.y.left : <ggplot2::element_text>
..@ family : NULL
..@ face : NULL
..@ italic : chr NA
..@ fontweight : num NA
..@ fontwidth : num NA
..@ colour : NULL
..@ size : NULL
..@ hjust : NULL
..@ vjust : NULL
..@ angle : NULL
..@ lineheight : NULL
..@ margin : <ggplot2::margin> num [1:4] 0 4.95 0 0
..@ debug : NULL
..@ inherit.blank: logi TRUE
$ axis.text.y.right : <ggplot2::element_text>
..@ family : NULL
..@ face : NULL
..@ italic : chr NA
..@ fontweight : num NA
..@ fontwidth : num NA
..@ colour : NULL
..@ size : NULL
..@ hjust : NULL
..@ vjust : NULL
..@ angle : NULL
..@ lineheight : NULL
..@ margin : <ggplot2::margin> num [1:4] 0 0 0 4.95
..@ debug : NULL
..@ inherit.blank: logi TRUE
$ axis.text.theta : NULL
$ axis.text.r : <ggplot2::element_text>
..@ family : NULL
..@ face : NULL
..@ italic : chr NA
..@ fontweight : num NA
..@ fontwidth : num NA
..@ colour : NULL
..@ size : NULL
..@ hjust : num 0.5
..@ vjust : NULL
..@ angle : NULL
..@ lineheight : NULL
..@ margin : <ggplot2::margin> num [1:4] 0 2.2 0 2.2
..@ debug : NULL
..@ inherit.blank: logi TRUE
$ axis.ticks : <ggplot2::element_blank>
$ axis.ticks.x : NULL
$ axis.ticks.x.top : NULL
$ axis.ticks.x.bottom : NULL
$ axis.ticks.y : NULL
$ axis.ticks.y.left : NULL
$ axis.ticks.y.right : NULL
$ axis.ticks.theta : NULL
$ axis.ticks.r : NULL
$ axis.minor.ticks.x.top : NULL
$ axis.minor.ticks.x.bottom : NULL
$ axis.minor.ticks.y.left : NULL
$ axis.minor.ticks.y.right : NULL
$ axis.minor.ticks.theta : NULL
$ axis.minor.ticks.r : NULL
$ axis.ticks.length : 'rel' num 0.5
$ axis.ticks.length.x : NULL
$ axis.ticks.length.x.top : NULL
$ axis.ticks.length.x.bottom : NULL
$ axis.ticks.length.y : NULL
$ axis.ticks.length.y.left : NULL
$ axis.ticks.length.y.right : NULL
$ axis.ticks.length.theta : NULL
$ axis.ticks.length.r : NULL
$ axis.minor.ticks.length : 'rel' num 0.75
$ axis.minor.ticks.length.x : NULL
$ axis.minor.ticks.length.x.top : NULL
$ axis.minor.ticks.length.x.bottom: NULL
$ axis.minor.ticks.length.y : NULL
$ axis.minor.ticks.length.y.left : NULL
$ axis.minor.ticks.length.y.right : NULL
$ axis.minor.ticks.length.theta : NULL
$ axis.minor.ticks.length.r : NULL
$ axis.line : <ggplot2::element_blank>
$ axis.line.x : NULL
$ axis.line.x.top : NULL
$ axis.line.x.bottom : NULL
$ axis.line.y : NULL
$ axis.line.y.left : NULL
$ axis.line.y.right : NULL
$ axis.line.theta : NULL
$ axis.line.r : NULL
$ legend.background : <ggplot2::element_blank>
$ legend.margin : NULL
$ legend.spacing : 'rel' num 2
$ legend.spacing.x : NULL
$ legend.spacing.y : NULL
$ legend.key : <ggplot2::element_blank>
$ legend.key.size : 'simpleUnit' num 1.2lines
..- attr(*, "unit")= int 3
$ legend.key.height : NULL
$ legend.key.width : NULL
$ legend.key.spacing : NULL
$ legend.key.spacing.x : NULL
$ legend.key.spacing.y : NULL
$ legend.key.justification : NULL
$ legend.frame : NULL
$ legend.ticks : NULL
$ legend.ticks.length : 'rel' num 0.2
$ legend.axis.line : NULL
$ legend.text : <ggplot2::element_text>
..@ family : NULL
..@ face : NULL
..@ italic : chr NA
..@ fontweight : num NA
..@ fontwidth : num NA
..@ colour : NULL
..@ size : 'rel' num 0.8
..@ hjust : NULL
..@ vjust : NULL
..@ angle : NULL
..@ lineheight : NULL
..@ margin : NULL
..@ debug : NULL
..@ inherit.blank: logi TRUE
$ legend.text.position : NULL
$ legend.title : <ggplot2::element_text>
..@ family : NULL
..@ face : NULL
..@ italic : chr NA
..@ fontweight : num NA
..@ fontwidth : num NA
..@ colour : NULL
..@ size : NULL
..@ hjust : num 0
..@ vjust : NULL
..@ angle : NULL
..@ lineheight : NULL
..@ margin : NULL
..@ debug : NULL
..@ inherit.blank: logi TRUE
$ legend.title.position : NULL
$ legend.position : chr "right"
$ legend.position.inside : NULL
$ legend.direction : NULL
$ legend.byrow : NULL
$ legend.justification : chr "center"
$ legend.justification.top : NULL
$ legend.justification.bottom : NULL
$ legend.justification.left : NULL
$ legend.justification.right : NULL
$ legend.justification.inside : NULL
[list output truncated]
@ complete: logi TRUE
@ validate: logi TRUEasia <- fruit %>%
filter(Region == "Asia")ggplot(fruit, aes(x = Fruit_kg, y = GDP)) +
geom_point(color = "gray", size = 1.8, alpha = 0.5) +
geom_point(data = asia, color = "red", size = 2.8, alpha = 0.9) +
scale_x_continuous(breaks = seq(0, 400, by = 100),
labels = label_number(suffix = " kg"),
limits = c(0, 400)) +
scale_y_log10(breaks = c(1000, 2000, 5000, 10000, 20000, 50000, 100000),
labels = label_dollar(accuracy = 1, big.mark = ",")) +
labs(title = "Fruit Supply and GDP per Capita in Asia",
x = "Fruit supply per person",
y = "GDP per capita") +
theme_minimal()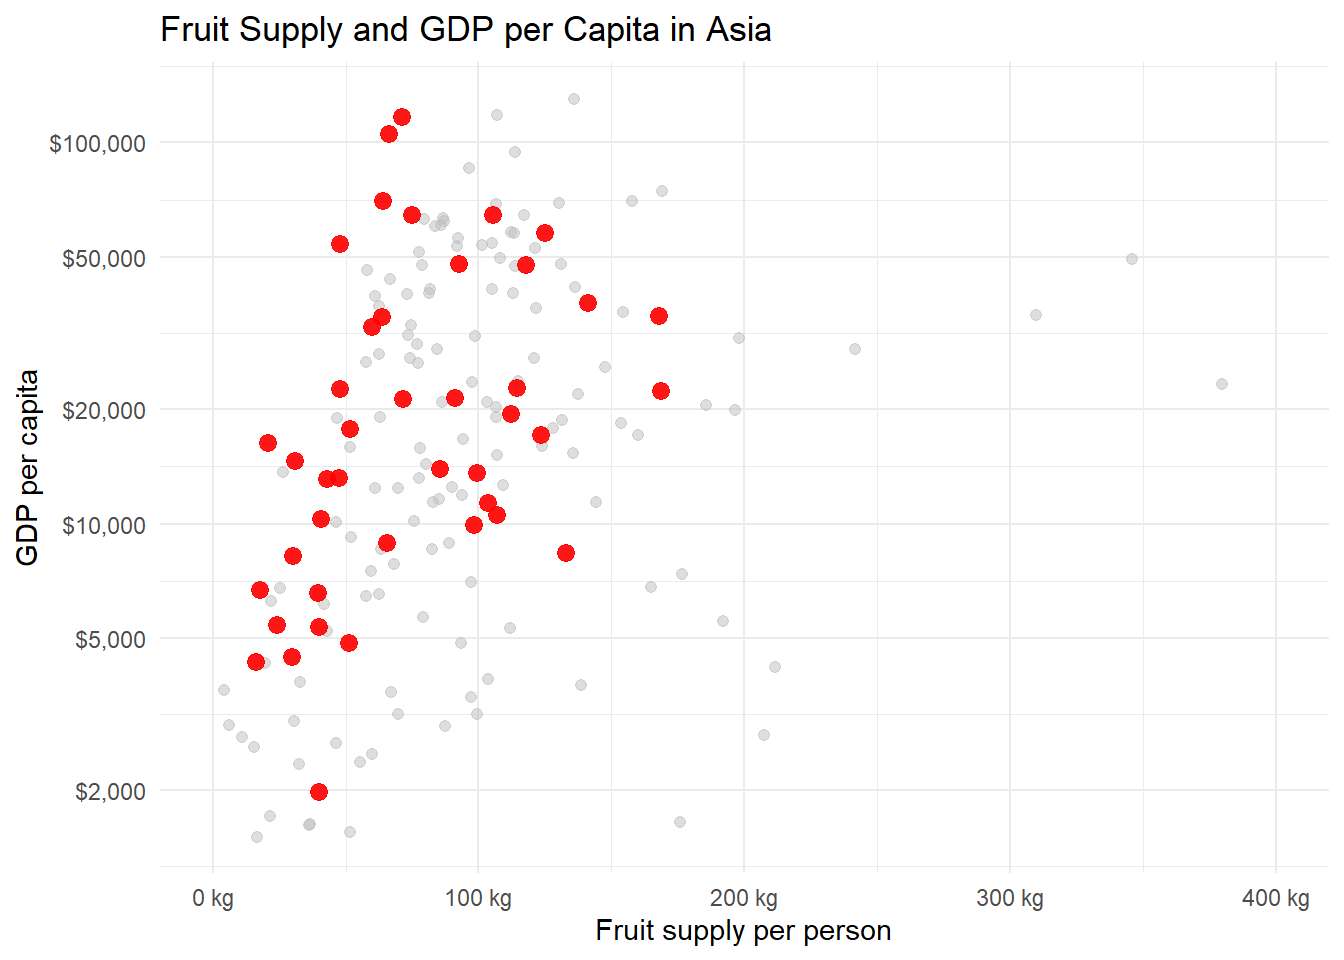
In completing this assignment I was able to receive a lot of help from the ? function in the console. There were a couple things I had forgotten how to do or in what order the arguments were supposed to go into but that helped me figure it out. I also realized the interesting access to fruit North America has even though a lot of other countries have more access to fruit growing climates. I also learned how to use the geom_text function which is very helpful for use cases like the 5 specific countries graph.
When we “highlight” data to tell a story we are able to better understand the impact we have on the data we collect. By intentionally highlighting the main graph, those specific countries and than Asia as region on its own, it is easy for me to tell the story that Asian countries don’t get nearly enough fruit since they are lower than other countries on the graphs.