Show the code
library(tidyverse)
library(httr2)
library(scales)What types and formats of drug products are being newly reported to CMS for the Medicaid Drug Rebate Program?
Are newly reported drugs mostly prescription drugs or over-the-counter drugs?
What unit types are most common among newly reported drugs?
Do prescription and over-the-counter drugs differ in the formats they come in?
library(tidyverse)
library(httr2)
library(scales)#Product Data for Newly Reported Drugs in the Medicaid Drug Rebate Program 10-20-2025-to-10-26-2025
url <- "https://download.medicaid.gov/data/mdrp-newly-rprt-drug-10-20-2025-to-10-26-2025.csv"
response <- request(url) %>%
req_user_agent("Mozilla/5.0") %>%
req_perform()
medicaid_drugs <- response %>%
resp_body_string() %>%
read_csv(show_col_types = FALSE)This dataset comes from CMS and includes drug products that were newly reported during the week of October 20 through October 26, 2025. I downloaded the file straight from the Medicaid website so the report can be run again without having to manually download the data.
medicaid_clean <- medicaid_drugs %>%
  select(`Labeler Name`,
    `FDA Name`,
    `Drug Type`,
    `Unit Type`,
    `Drug Category`,
    `Labeler Status`,
    `COD Status`) %>%
  mutate(drug_type_label = case_when(
      as.character(`Drug Type`) == "1" ~ "Prescription",
      as.character(`Drug Type`) == "2" ~ "Over-the-Counter",
      TRUE ~ "Unknown"),
    unit_type_label = case_when(`Unit Type` == "AHF" ~ "Anti-Hemophilic Factor",
      `Unit Type` == "CAP" ~ "Capsule",
      `Unit Type` == "EA" ~ "Each",
      `Unit Type` == "GM" ~ "Gram",
      `Unit Type` == "MCI" ~ "Millicurie",
      `Unit Type` == "ML" ~ "Milliliter",
      `Unit Type` == "UCI" ~ "Microcurie",
      `Unit Type` == "SUP" ~ "Suppository",
      `Unit Type` == "TAB" ~ "Tablet",
      `Unit Type` == "TDP" ~ "Transdermal Patch",
      TRUE ~ "Unknown"),
    `Drug Category` = as.factor(`Drug Category`),
    `Labeler Status` = as.factor(`Labeler Status`),
    `COD Status` = as.factor(`COD Status`)) %>%
  filter(drug_type_label != "Unknown",
    unit_type_label != "Unknown") %>%
  arrange(drug_type_label, unit_type_label)
I kept the columns that were useful for my questions and changed some of the short codes into full names. For example, drug type 1 became prescription, drug type 2 became over-the-counter, and ML became milliliter. I removed rows with drug or unit codes that were not included in my labels.
drug_type_summary <- medicaid_clean %>%
  count(drug_type_label, sort = TRUE) %>%
  mutate(percent = n / sum(n)) %>%
  mutate(percent = paste0(round(percent * 100, 1), "%"))

drug_type_summary
# A tibble: 2 × 3
drug_type_label n percent
<chr> <int> <chr>
1 Prescription 107 95.5%
2 Over-the-Counter 5 4.5% The first summary table shows how many newly reported drugs were prescription drugs and how many were over-the-counter drugs. It also shows the percent for each group. This helps answer my first question because it shows which drug type appears more often in this dataset.
unit_type_summary <- medicaid_clean %>%
  count(unit_type_label, sort = TRUE) %>%
  mutate(percent = n / sum(n)) %>%
  mutate(percent = paste0(round(percent * 100, 1), "%"))

unit_type_summary
# A tibble: 6 × 3
unit_type_label n percent
<chr> <int> <chr>
1 Milliliter 43 38.4%
2 Tablet 40 35.7%
3 Each 20 17.9%
4 Capsule 6 5.4%
5 Gram 2 1.8%
6 Suppository 1 0.9% The second summary table shows the most common unit types. Unit type means the format or measurement the drug comes in, such as tablets, capsules, milliliters, grams, or patches. This helps answer my second question because it shows what forms the newly reported drugs most often come in.
drug_type_unit_summary <- medicaid_clean %>%
  group_by(drug_type_label, unit_type_label) %>%
  summarize(number_of_drugs = n(), .groups = "drop") %>%
  group_by(drug_type_label) %>%
  mutate(percent_within_type = number_of_drugs / sum(number_of_drugs)) %>%
  mutate(percent_within_type_label = paste0(round(percent_within_type * 100, 1), "%")) %>%
  ungroup()

drug_type_unit_summary
# A tibble: 8 × 5
drug_type_label unit_type_label number_of_drugs percent_within_type
<chr> <chr> <int> <dbl>
1 Over-the-Counter Gram 1 0.2
2 Over-the-Counter Milliliter 3 0.6
3 Over-the-Counter Suppository 1 0.2
4 Prescription Capsule 6 0.0561
5 Prescription Each 20 0.187
6 Prescription Gram 1 0.00935
7 Prescription Milliliter 40 0.374
8 Prescription Tablet 40 0.374
# ℹ 1 more variable: percent_within_type_label <chr>The third summary table compares drug type and unit type together. It shows how many prescription and over-the-counter drugs fall into each unit type. It also shows the percent within each drug type, which makes the comparison more fair. This matters because one drug type may have more total records than the other.
drug_type_unit_wide <- drug_type_unit_summary %>%
  select(unit_type_label, drug_type_label, number_of_drugs) %>%
  pivot_wider(names_from = drug_type_label,
    values_from = number_of_drugs,
    values_fill = 0) %>%
  mutate(total = Prescription + `Over-the-Counter`) %>%
  arrange(desc(total))

drug_type_unit_wide
# A tibble: 6 × 4
unit_type_label `Over-the-Counter` Prescription total
<chr> <int> <int> <int>
1 Milliliter 3 40 43
2 Tablet 0 40 40
3 Each 0 20 20
4 Capsule 0 6 6
5 Gram 1 1 2
6 Suppository 1 0 1I used pivot_wider() to change the summary table so prescription and over-the-counter counts appear next to each other. This made it easier to compare the two drug types by unit type. Since this project only uses one main dataset, pivoting made more sense than joining or binding another dataset.
drug_type_summary %>%
  ggplot(aes(x = drug_type_label, y = n)) +
  geom_col() +
  geom_text(aes(label = n), vjust = -0.3) +
  labs(title = "Newly Reported Medicaid Drugs by Drug Type",
    subtitle = "Comparison of prescription and over-the-counter drug products",
    x = "Drug Type",
    y = "Number of Drug Products") +
  theme_bw()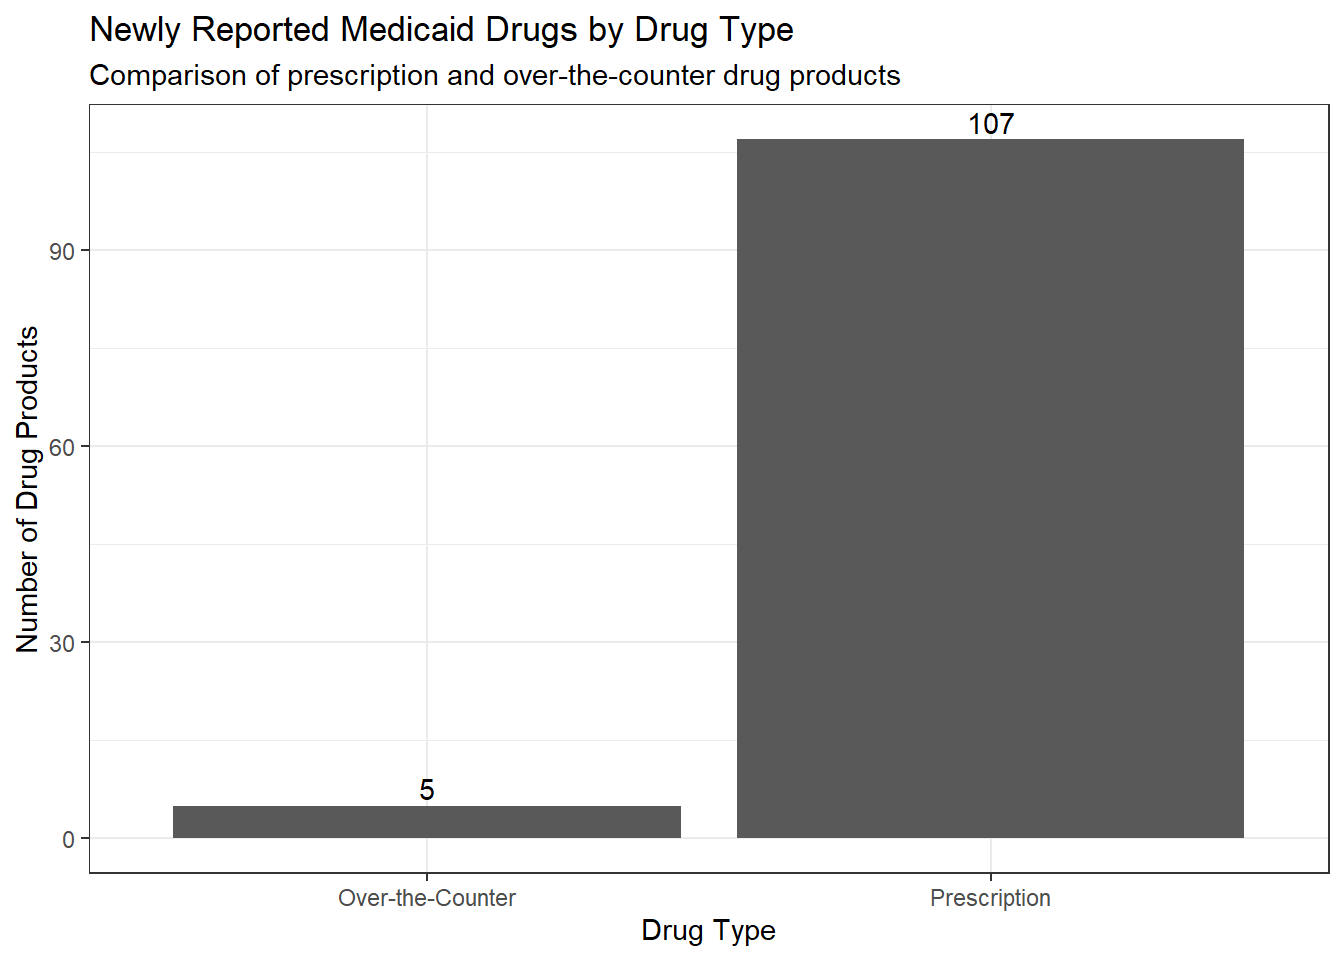
The first graph compares prescription drugs and over-the-counter drugs. This graph is a simple bar chart, so the taller bar shows which drug type had more newly reported products. This helps answer whether the drugs in this reporting period were mostly prescription or mostly over-the-counter.
Based on this graph, newly reported drugs were mostly prescription. They made up about 95%% of the data, while over-the-counter drugs made up about 5%. This shows that the drugs newly reported to CMS during this week were more commonly prescription products.
unit_type_summary %>%
  ggplot(aes(x = reorder(unit_type_label, n), y = n)) +
  geom_col() +
  coord_flip() +
  labs(title = "Most Common Unit Types Among Newly Reported Medicaid Drugs",
    subtitle = "Unit type shows the form or measurement used for the drug product",
    x = "Unit Type",
    y = "Number of Drug Products") +
  theme_bw()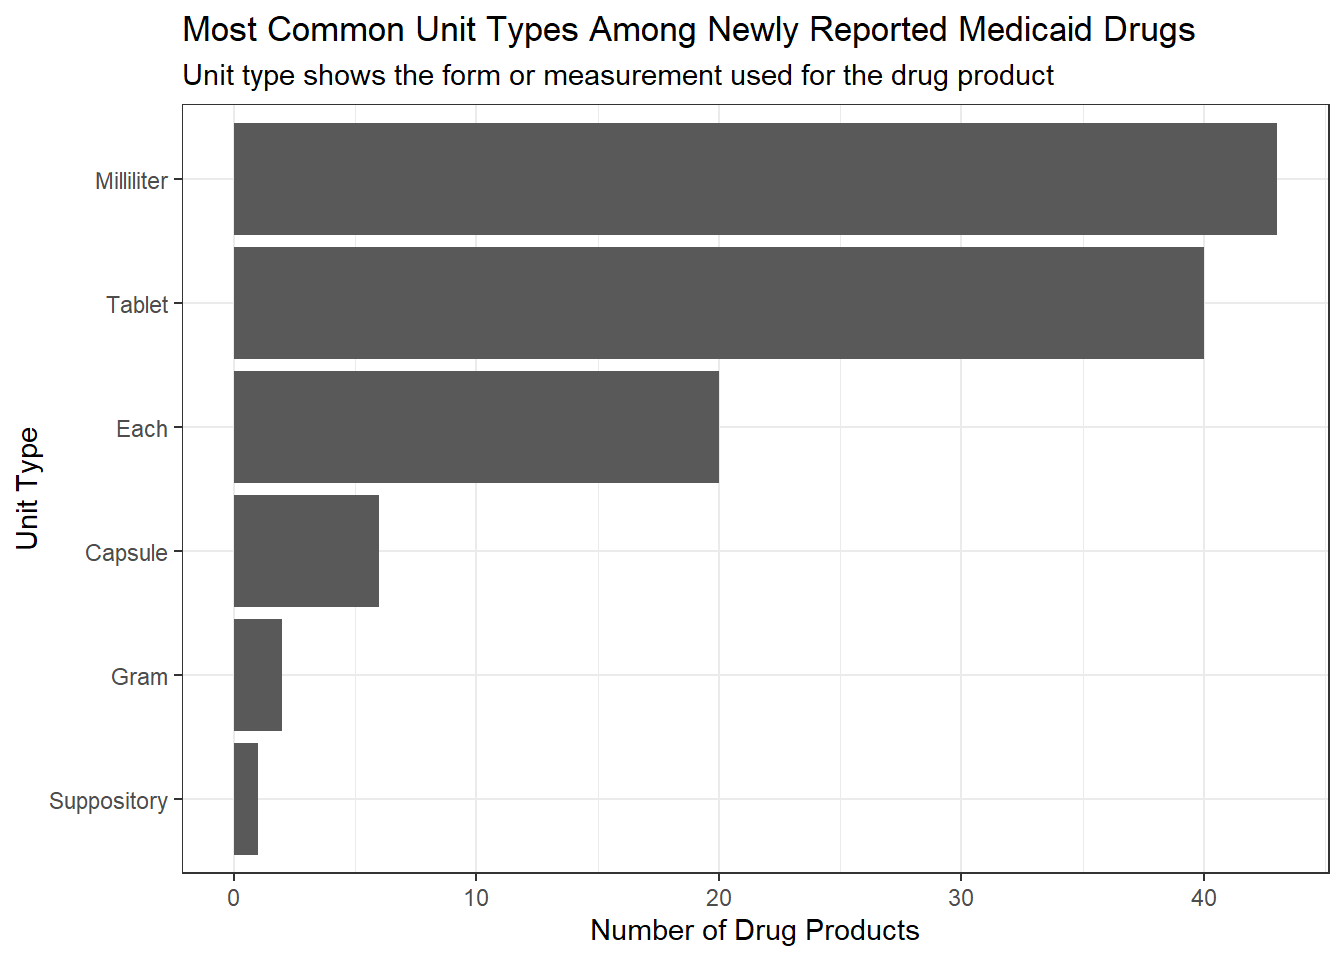
The second graph shows the most common unit types in the dataset. This helps show what formats the drugs came in. For example, some drugs may be listed as tablets, capsules, milliliters, grams, or other units. The longer bars show the unit types that appeared most often.
The most common unit types were millimeter, tablet, and patches. This means that many of the newly reported drugs came in these formats. Less common unit types, such as capsules, appeared less often in this reporting period.
drug_type_unit_summary %>%
  ggplot(aes(x = reorder(unit_type_label, percent_within_type),
    y = percent_within_type,
    fill = drug_type_label)) +
  geom_col(position = "dodge") +
  coord_flip() +
  scale_y_continuous(labels = percent) +
  labs(title = "Unit Type Distribution Within Each Drug Type",
    subtitle = "Percent of prescription and over-the-counter products by unit type",
    x = "Unit Type",
    y = "Percent Within Drug Type",
    fill = "Drug Type") +
  theme_bw()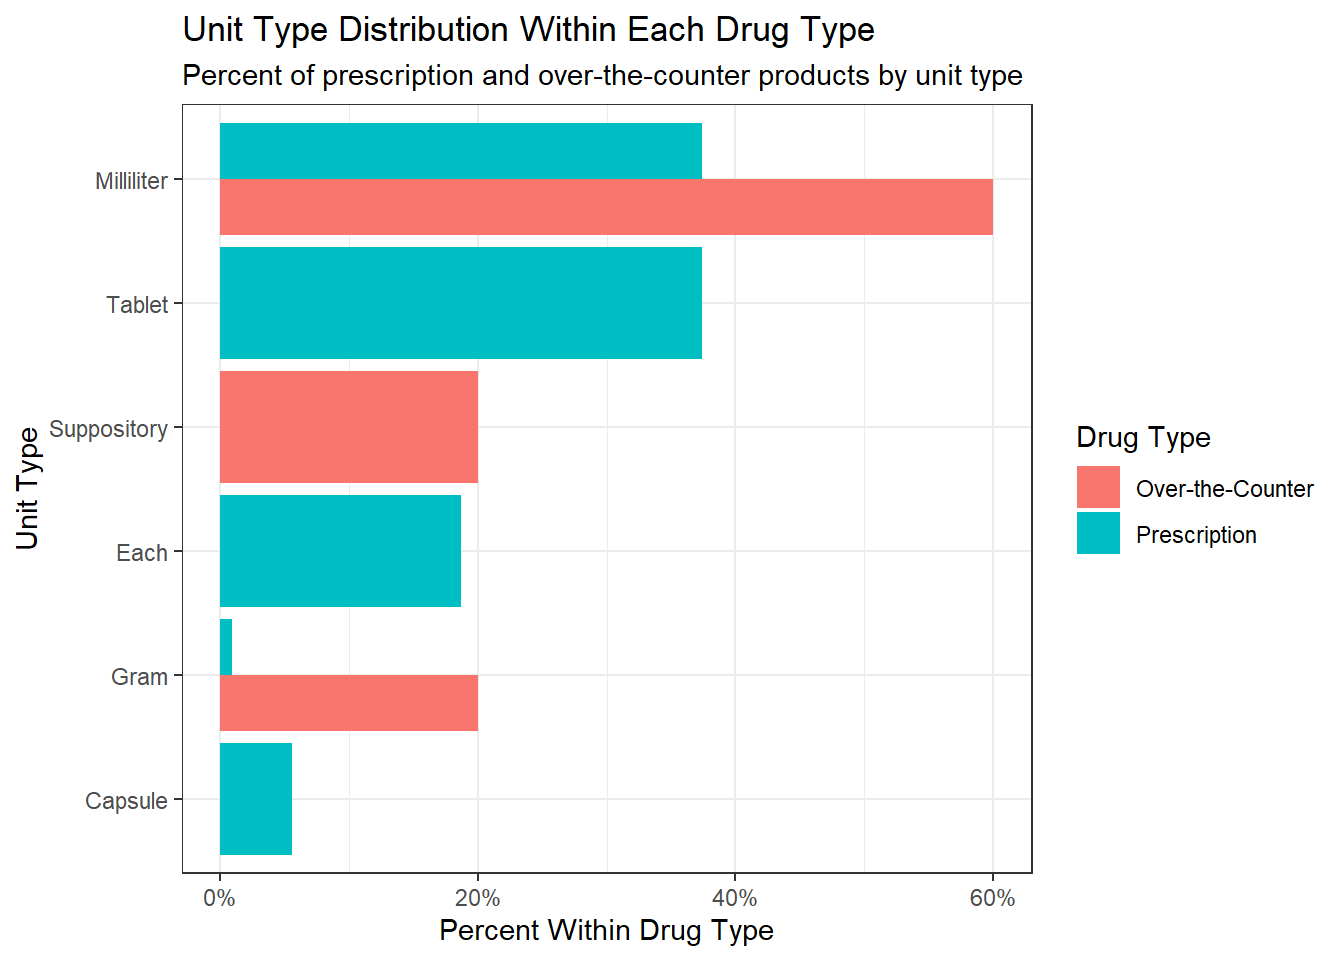
The third graph compares unit type within prescription and over-the-counter drugs. Instead of only using raw counts, this graph uses percentages within each drug type. This makes it easier to compare the formats because prescription and over-the-counter drugs may not have the same total number of records.
This graph shows that prescription and over-the-counter drugs had very different format patterns. For prescription drugs, the most common unit type was tied with tablets and millimeters. For over-the-counter drugs, the most common unit type was also millimeter. This suggests that the format of a drug may depend on whether it is prescription or over-the-counter.
Overall, this project shows that the newly reported Medicaid drugs in this dataset were mostly prescription. The most common drug formats were millimeter, tablets, and patches. When comparing prescription and over-the-counter drugs, the formats were dissimilar. These results help describe what kinds of drug products were newly reported to CMS during this specific reporting period.
These results could be useful because they show what kinds of drug products are entering the Medicaid reporting system. If most newly reported drugs are prescription drugs, then CMS or Medicaid analysts may need to pay close attention to prescription drug reporting. If certain unit types are much more common, then those formats may be important to check carefully for accurate reporting. However, this dataset only covers one reporting period, so the results should not be used to describe the entire Medicaid drug market.