Show the code
library(tidyverse)
library(ggplot2)
library(dplyr)A client planning public-service commercials wanted to know who to reach, what message to use, and when to air them. Using FiveThirtyEight’s data on U.S. gun deaths, I broke deaths down by age, race, intent (homicide vs. suicide), and season, and wrote each chart’s takeaway for that audience.
library(tidyverse)
library(ggplot2)
library(dplyr)df <- read_csv("https://github.com/fivethirtyeight/guns-data/raw/master/full_data.csv")In the interactive data I discovered the animations and the different styles of displaying the data. It was also interesting to see how they filtered and categorized the data using different arcs and colors.
nona <- df %>%
filter(!is.na(intent) & !is.na(sex) & !is.na(age) & !is.na(race) & !is.na(month)) nona <- nona %>%
mutate(Age = ifelse(age < 15, "Under 15",
ifelse(age >= 15 & age <= 34, "15 - 34",
ifelse(age >= 35 & age <= 64, "35 - 64", "65+"))))
nona$Age <- factor(nona$Age, levels = c("Under 15", "15 - 34", "35 - 64", "65+"))ggplot(nona, mapping = aes(x = Age)) +
geom_bar()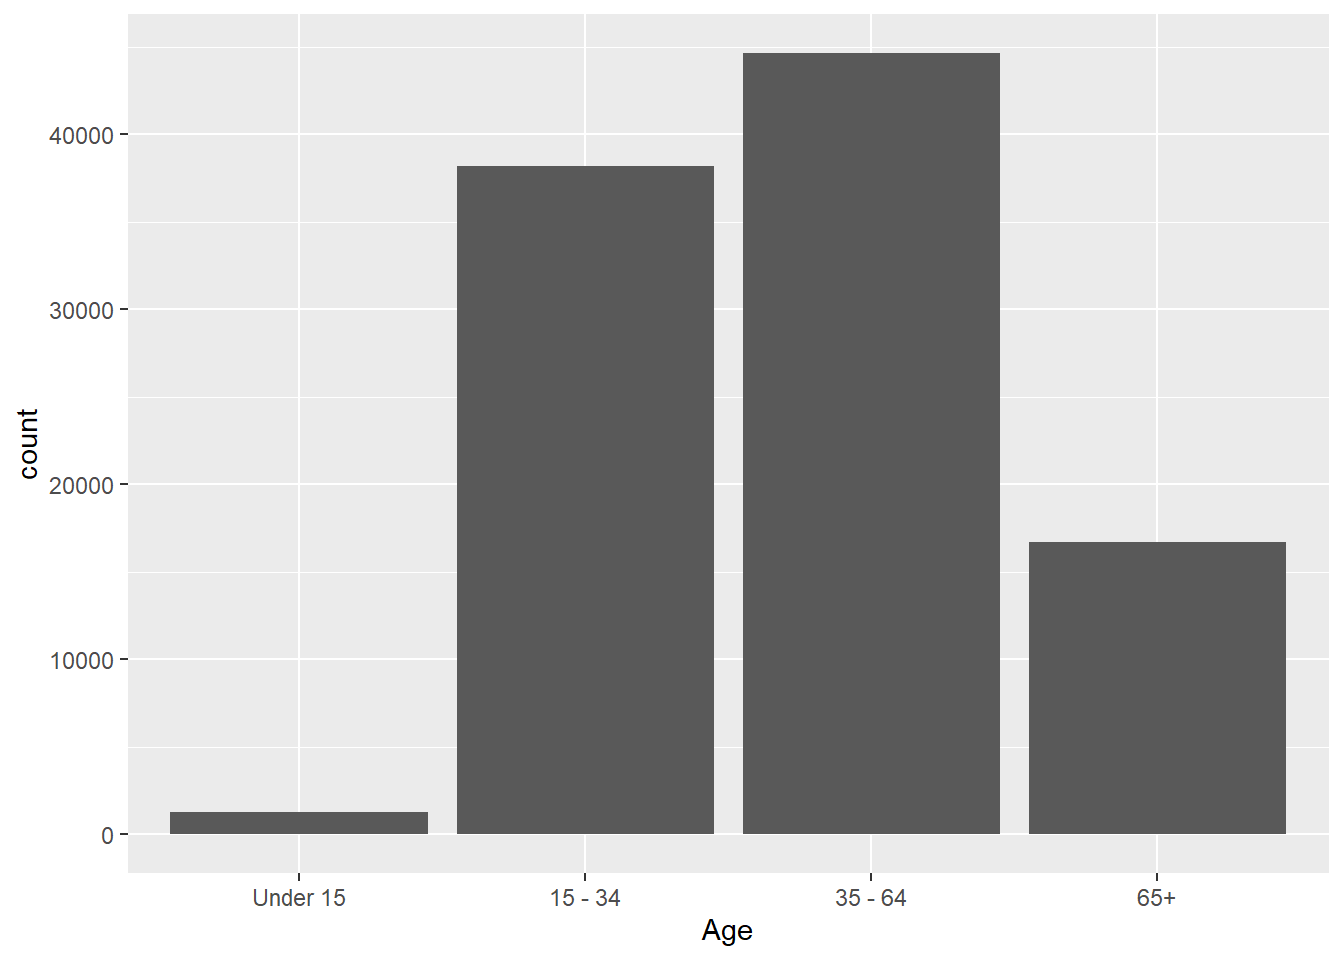
Here in this visualization we can see the different age demographics that are dying from gun-related incidents. The largest group is young adults from ages 15–34. This shows that younger adults are an important group for the client to focus on. Commercials aimed at younger people could focus on gun safety, violence prevention, and making safer choices.
ggplot(nona, mapping = aes(x = race)) +
  geom_bar()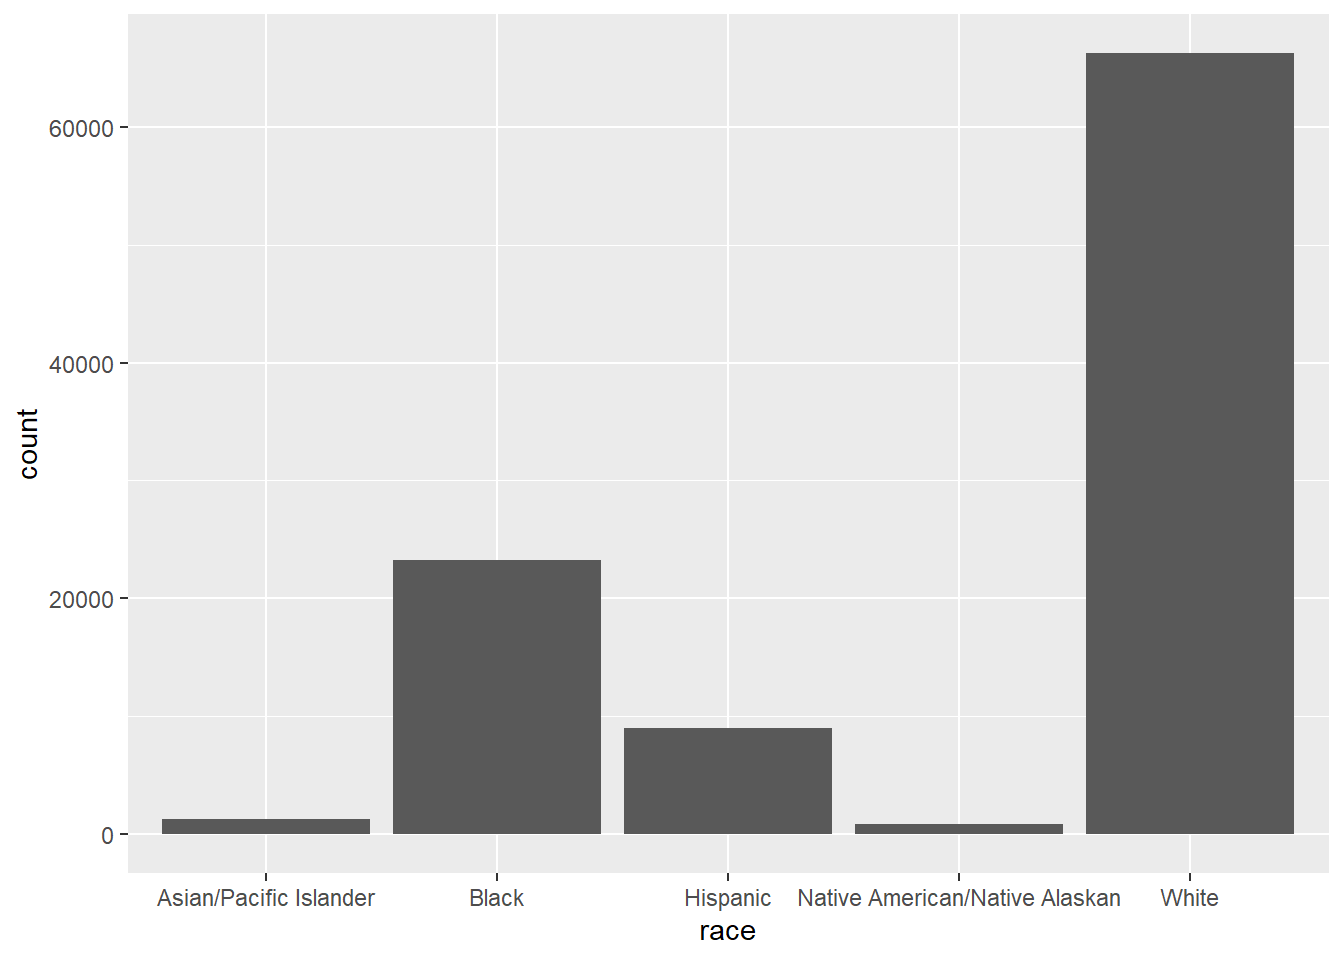
This graph shows the total number of gun deaths by race. This helps the client see which racial groups have the highest number of deaths in the dataset. The client should be careful not to blame any group, but this information can help them make commercials that are more specific to communities that are affected. The message should focus on prevention, safety, and support.
cleanintent <- nona %>% filter(intent != "Unknown")ggplot(cleanintent, mapping = aes(x = Age, fill = intent)) +
geom_bar(position = "dodge")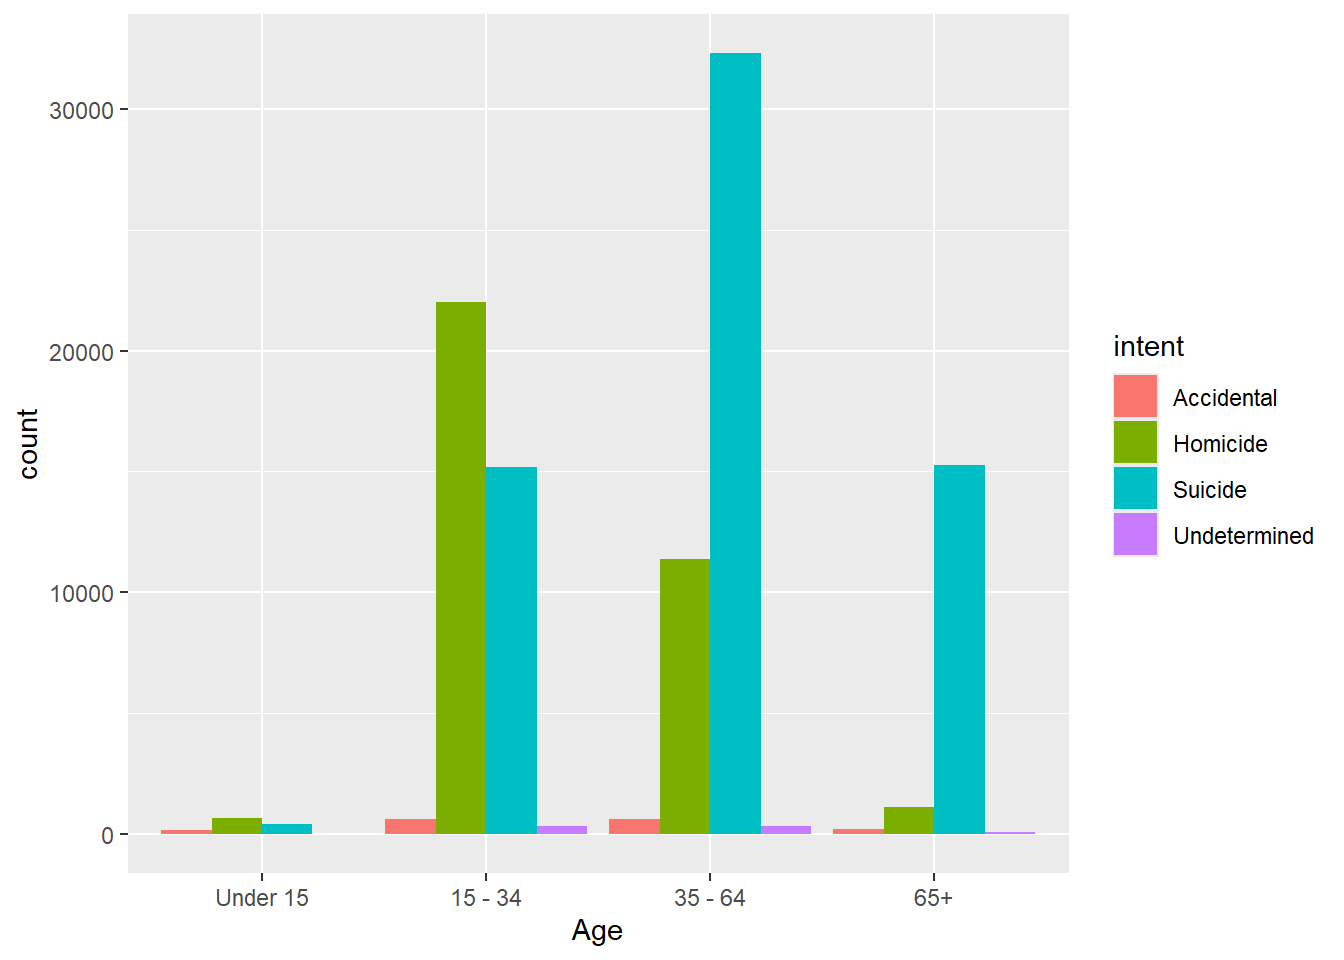
We can clearly see that different age groups are affected by different types of gun deaths. Younger adults have more homicide deaths, while older adults have more suicide deaths. This is important because the client should not use the same message for every age group. Commercials for younger adults could focus more on violence prevention, while commercials for older adults could focus more on suicide prevention and safe gun storage.
season <- nona %>%
  mutate(Season = case_when(month %in% c(12, 1, 2) ~ "Winter",
      month %in% c(3, 4, 5) ~ "Spring",
      month %in% c(6, 7, 8) ~ "Summer",
      month %in% c(9, 10, 11) ~ "Fall"))

season_deaths <- season %>%
  group_by(Season) %>%
summarize(total_deaths = n(), .groups = "drop")ggplot(season_deaths, aes(x = Season, y = total_deaths)) +
geom_col() +
labs(title = "Total Gun Deaths by Season",
x = "Season",
y = "Total Deaths")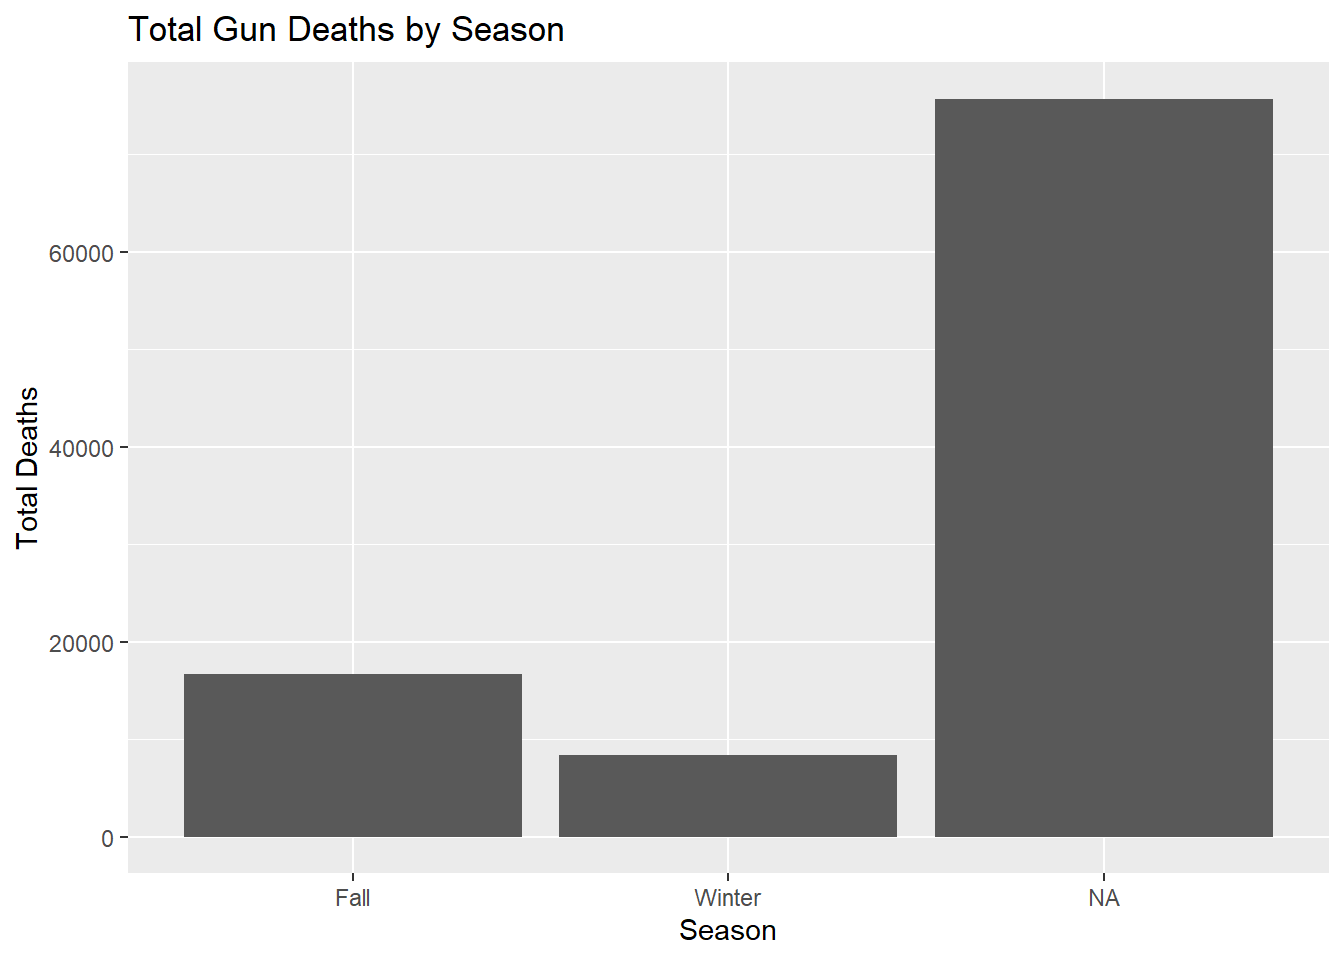
This graph shows which season has the most gun deaths. This helps the client know when commercials might be most needed. If one season has more deaths, the client could run more commercials during that time. This gives the client a simple way to think about when prevention messages should be strongest.
season_intent <- season %>%
  filter(intent != "Unknown") %>%
  group_by(Season, intent) %>%
summarize(total_deaths = n())ggplot(season_intent, aes(x = Season, y = total_deaths, fill = intent)) +
geom_col(position = "dodge")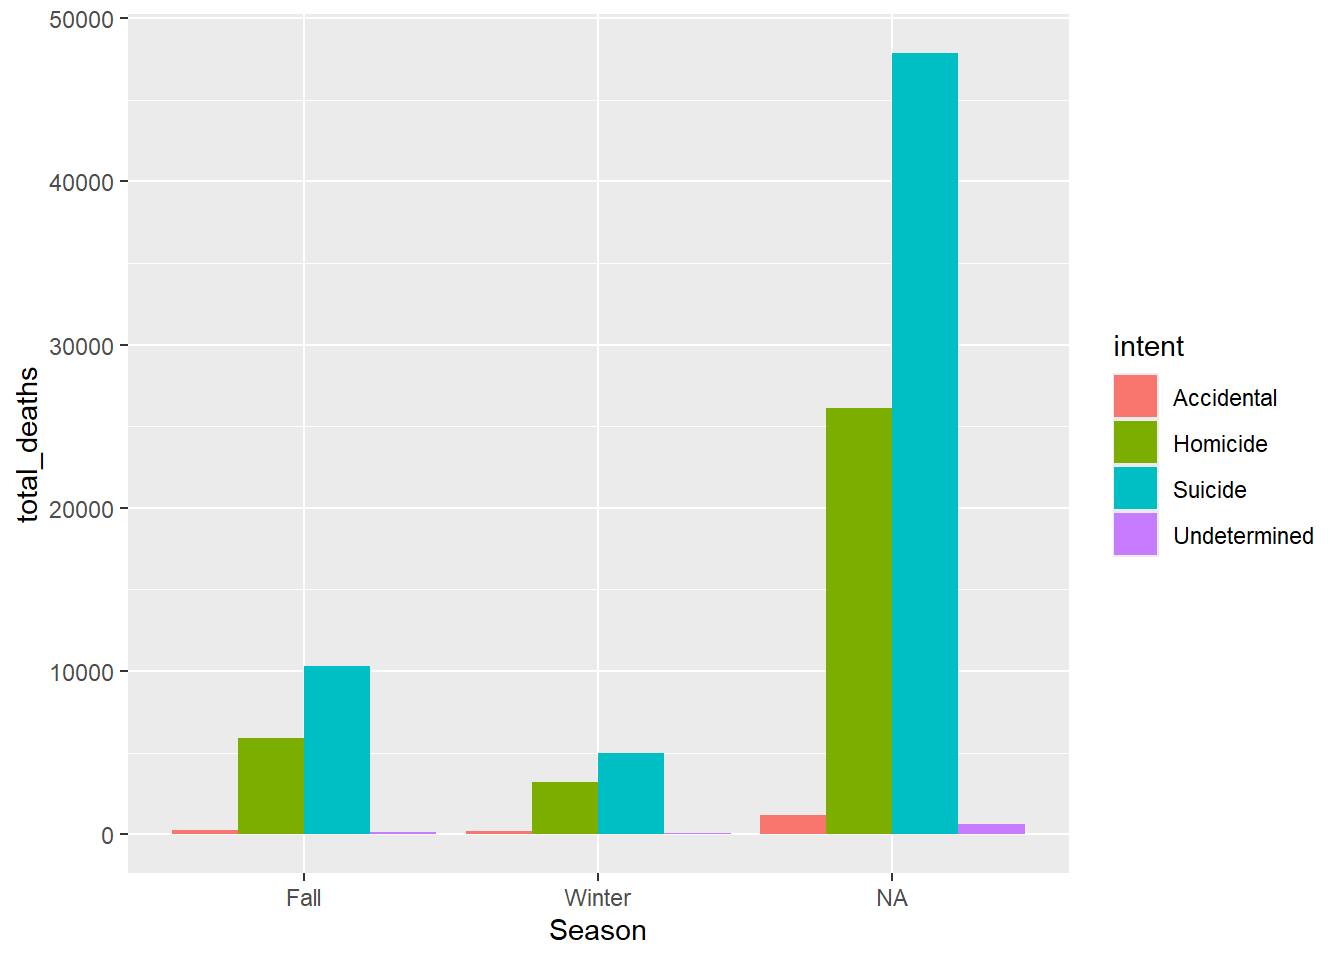
This graph shows what kind of gun deaths happen in each season. This helps the client know what the commercials should talk about. For example, some commercials could focus on suicide prevention, while others could focus on violence prevention. The client can use this graph to match the commercial message to the biggest problem in each season.
season_age <- season %>% group_by(Season, Age) %>%
summarize(total_deaths = n())ggplot(season_age, aes(x = Season, y = total_deaths, fill = Age)) +
geom_col(position = "dodge")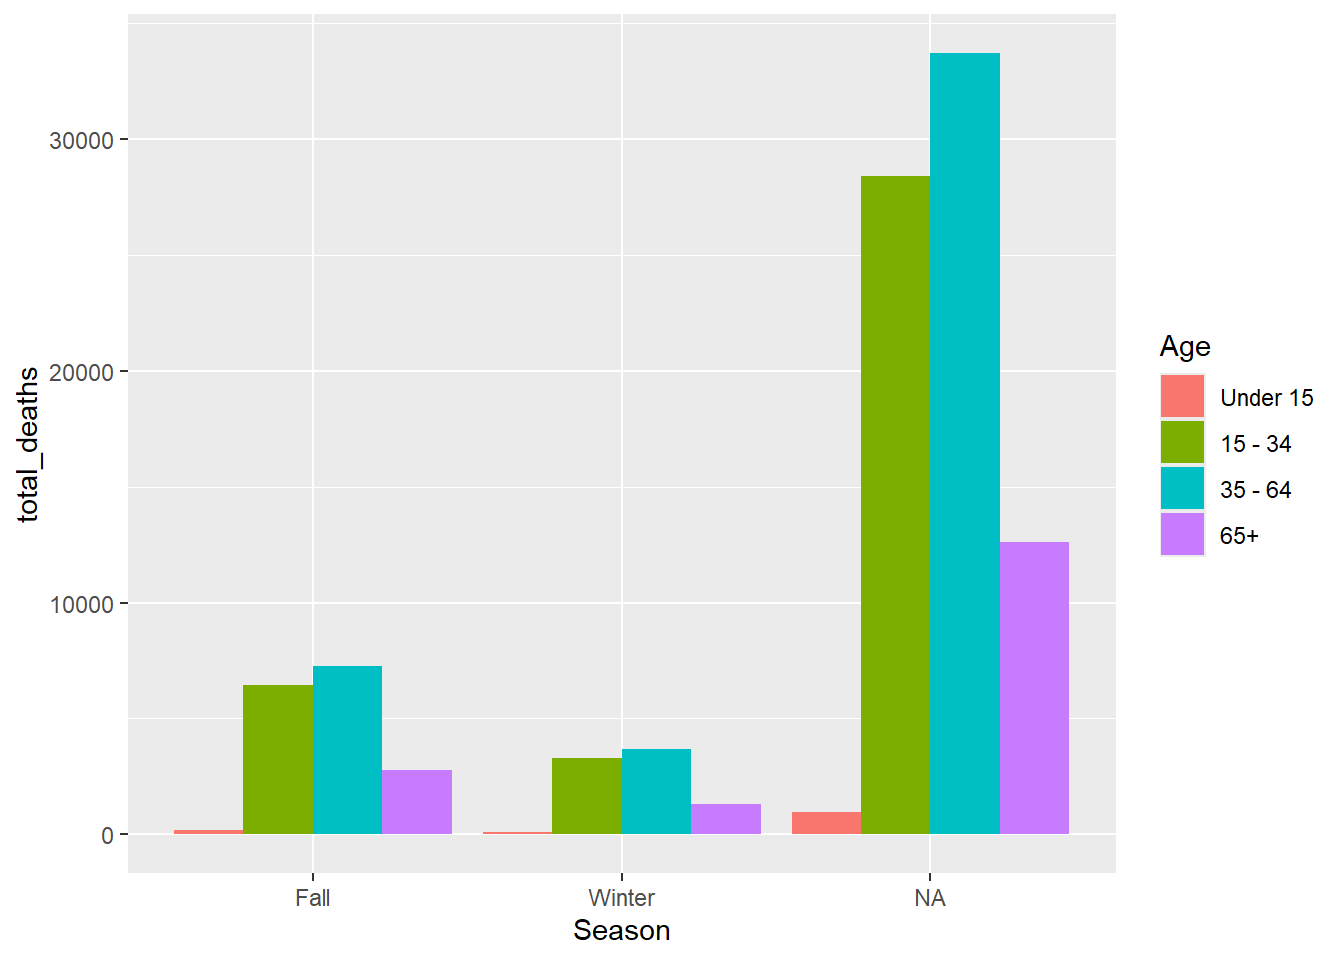
This graph shows which age groups have the most gun deaths in each season. This helps the client know who the commercials should be made for. If younger adults have more deaths, the client could make commercials aimed at younger people. If older adults are also high, then the client could make a different commercial about suicide prevention and safe gun storage.