Show the code
library(tidyverse)Chipotle wants to run a one-day promotion on its slowest day. In the raw data, each restaurant’s weekday traffic is stored as one text field that lists all seven days and their visit counts. I wrote two small parsing functions with stringr, mapped them over every location with purrr, and unnested the result into a tidy table so visits could be compared across days.
library(tidyverse)chipotle <- read_csv("https://byuistats.github.io/M335/data/chipotle_reduced.csv")table_maker <- function(extractor) {
days <- str_extract_all(extractor,
"Monday|Tuesday|Wednesday|Thursday|Friday|Saturday|Sunday")[[1]]
amount <- str_extract_all(extractor, "\\d+")[[1]] %>%
as.integer()
tibble(days = days, amount = amount)
}highest_day <- function(extractor) {
df <- table_maker(extractor)
df %>%
filter(amount == max(amount)) %>%
pull(days) %>%
paste(collapse = ", ")
}weekday_levels <- c("Monday", "Tuesday","Wednesday",
"Thursday", "Friday", "Saturday", "Sunday")chipotle_nested <- chipotle %>%
mutate(day_visits = map(popularity_by_day, table_maker),
busiest_day = map_chr(popularity_by_day, highest_day))saveRDS(chipotle_nested, file = file.path(tempdir(), "chipotle_nested.rds"))chipotle_visits_long <- chipotle_nested %>%
select(placekey, city, region, day_visits) %>%
unnest(day_visits) %>%
mutate(days = factor(days, levels = weekday_levels))visits_by_weekday <- chipotle_visits_long %>%
filter(!is.na(days), !is.na(amount)) %>%
group_by(days) %>%
summarize(total_visits = sum(amount, na.rm = TRUE),
.groups = "drop")ggplot(visits_by_weekday, aes(x = days, y = total_visits)) +
geom_col() +
geom_text(aes(label = scales::comma(total_visits)), vjust = -0.4, size = 3.5) +
scale_y_continuous(labels = scales::comma, expand = expansion(mult = c(0, 0.12))) +
labs(title = "Total Chipotle Visits by Day of the Week",
y = "Total visits") +
theme_minimal()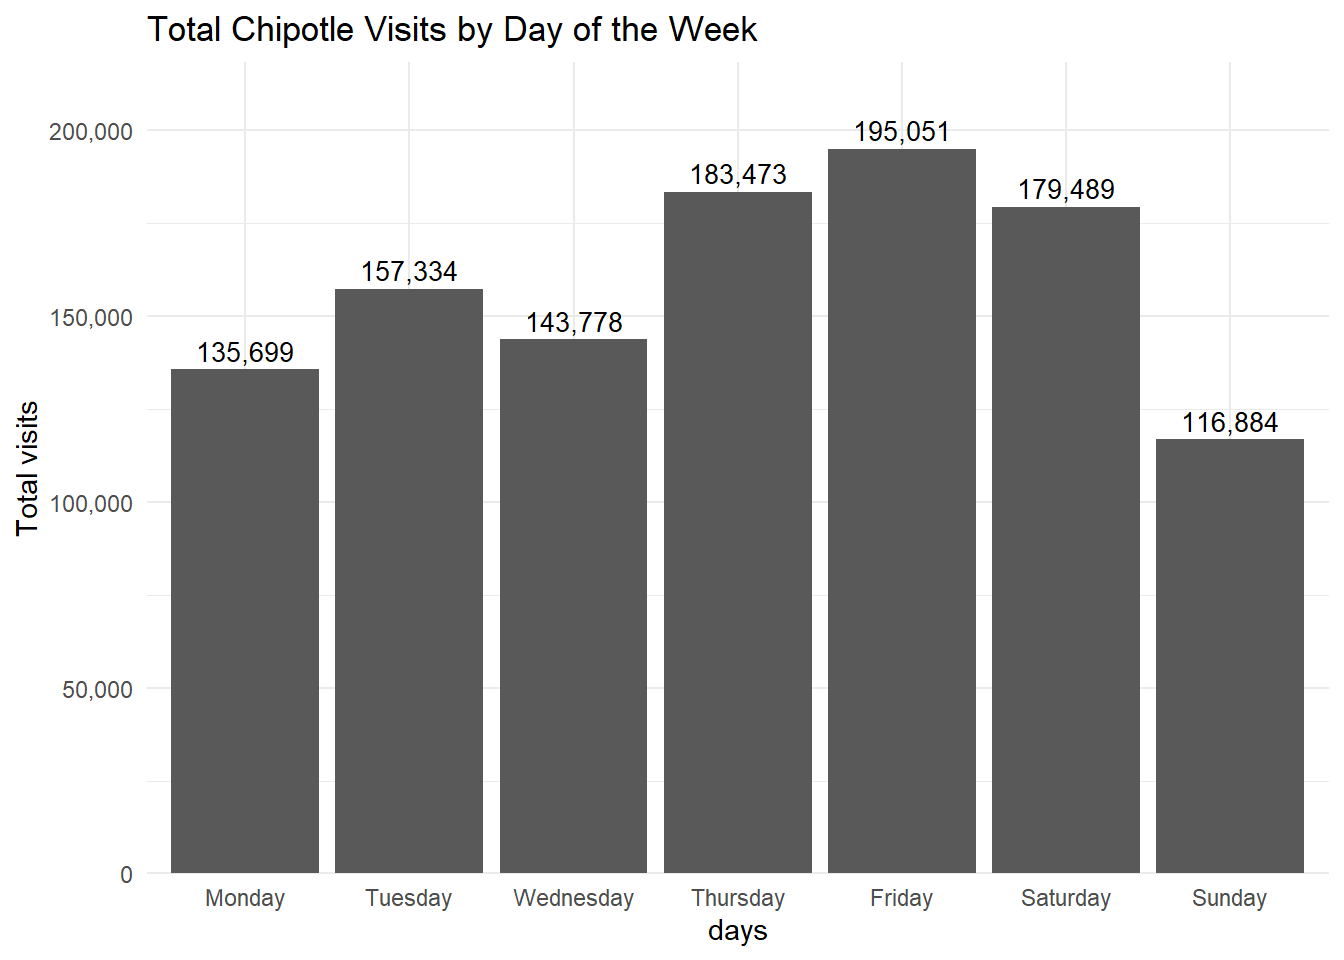
In the long version of the dataset, one row represents one weekday at one Chipotle restaurant. Each restaurant can have up to seven rows, with one row for each day of the week. The amount column shows how many visits that restaurant had on that weekday. In the busiest-day summary, one row represents one weekday and the number of restaurants where that day had the highest visit count.
The total visit graph shows that Sunday has the lowest traffic, with 116,884 visits. Monday is also fairly slow, but Sunday is clearly the weakest day. Based on this graph, Chipotle should consider running the promotion on Sunday to help bring in more customers on a slower day.
busiest_day_counts <- chipotle_nested %>%
  select(placekey, busiest_day) %>%
  filter(!is.na(busiest_day), busiest_day != "") %>%
  separate_rows(busiest_day, sep = ", ") %>%
  mutate(busiest_day = factor(busiest_day, levels = weekday_levels)) %>%
count(busiest_day, name = "store_count")ggplot(busiest_day_counts, aes(x = busiest_day, y = store_count)) +
geom_col() +
geom_text(aes(label = store_count), vjust = -0.4, size = 3.5) +
scale_y_continuous(breaks = scales::pretty_breaks(), expand = expansion(mult = c(0, 0.12))) +
labs(title = "Busiest Day at Chipotle Restaurants",
y = "Number of restaurant locations") +
theme_minimal()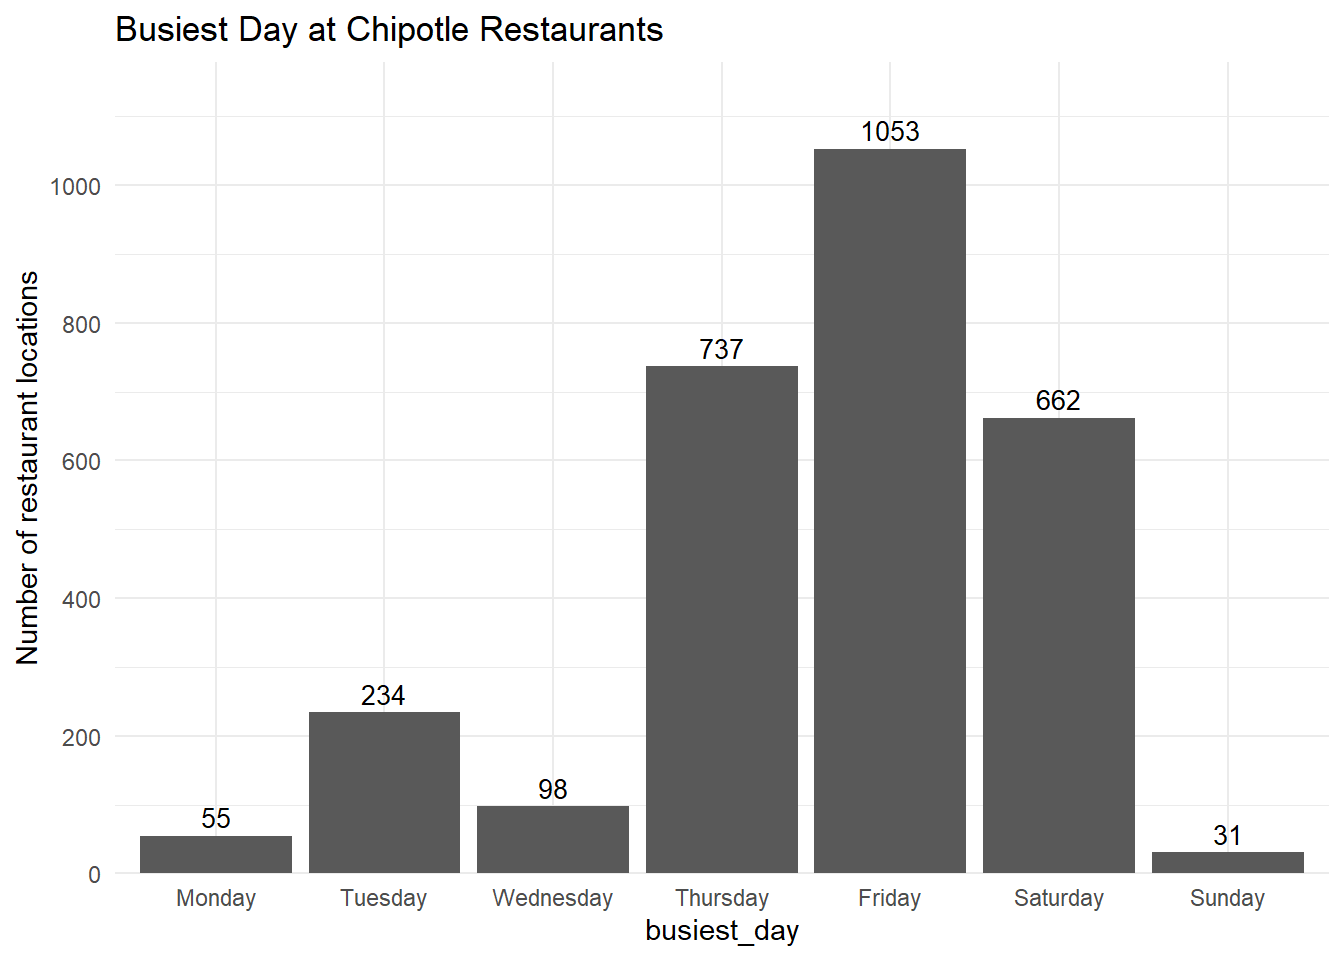
The busiest-day graph also points to Sunday as the best promotion day. Sunday is the busiest day for only 31 restaurants, which is lower than every other weekday. Friday is already the busiest day for 1,053 restaurants, so it would make less sense to use the promotion on a day that is already doing well.
After looking at both graphs, I recommend that Chipotle run the promotion on Sunday. Sunday had the fewest total visits and was also the least common busiest day among individual restaurant locations. Both graphs show that Sunday is a weak day across the company, so a promotion may have the best chance of increasing traffic then. Monday could be a second option, but the evidence for Sunday is stronger.
The total-visits graph had the greatest effect on my choice because it directly shows how many customer visits took place on each day. The busiest-day graph was also helpful because it showed that Sunday was not just weak because of a few stores; it was rarely the strongest day at individual locations. Another clear pattern is that Friday is the strongest day overall, with the highest total visits and the largest number of restaurants where it is the busiest day. This means Chipotle probably does not need to use the promotion on Friday.