Show the code
library(tidyverse)
library(tidyr)
library(readr)
library(readxl)The source is an Excel workbook of average male height by country, laid out wide with one column per decade and header rows above the data. I skipped the header rows, used pivot_longer() to reshape it into one row per country and decade, dropped missing measurements, converted centimeters to inches, and highlighted Germany against every other country.
library(tidyverse)
library(tidyr)
library(readr)
library(readxl)height <- read_excel("data/Height.xlsx", skip = 2)height_tidy <- height %>%
pivot_longer(cols = 3:ncol(height), names_to = "Year", values_to = "Height") %>%
drop_na(Height)
height_tidy# A tibble: 1,340 × 4
Code `Continent, Region, Country` Year Height
<dbl> <chr> <chr> <dbl>
1 40 Austria 1820 164.
2 40 Austria 1830 163.
3 40 Austria 1840 165.
4 40 Austria 1850 166.
5 40 Austria 1860 166.
6 40 Austria 1870 167.
7 40 Austria 1880 168.
8 40 Austria 1890 168.
9 40 Austria 1900 169.
10 40 Austria 1910 169.
# ℹ 1,330 more rowsggplot(height_tidy, aes(x = Year, y = Height / 2.54)) +
geom_point(color = "gray50", alpha = 0.5, size = 2) +
geom_point(data = height_tidy %>%
filter(`Continent, Region, Country` == "Germany"), color = "red", size = 3) +
labs(title = "Average Male Height by Decade",
x = "Decade") +
theme_bw()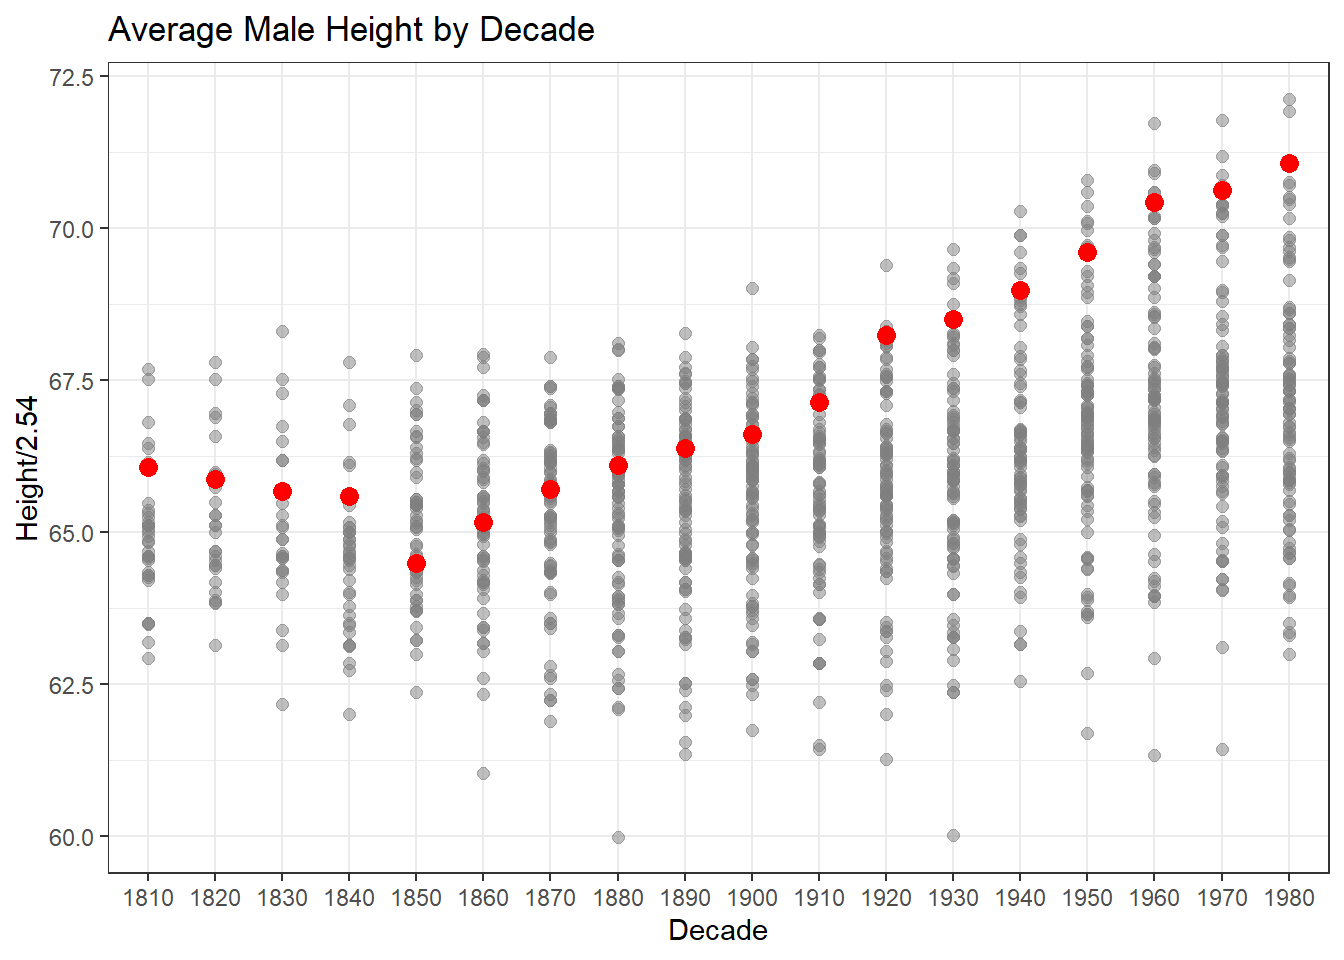
The data shows that people seem to be getting taller over time. As the years go on, many of the height values get higher. Germany also seems to follow this pattern. The data is not perfect because some values are missing, but overall it supports the idea that humans have gotten taller over the years.