Show the code
library(nycflights13)
library(tidyverse)
library(scales)Using every flight that left New York City in 2013 (nycflights13), I answered two traveler questions: which NYC origin airport gives the best chance of arriving on time when flying Delta, and which destination airport is the worst for arrival delays.
library(nycflights13)
library(tidyverse)
library(scales)Which origin airport is best to minimize my chances of a late arrival when I am using Delta Airlines?
delta_flights <- flights %>%
  filter(carrier == "DL") %>%
  filter(!is.na(arr_delay)) %>%
mutate(late_15 = arr_delay > 15)origin_summary <- delta_flights %>%
group_by(origin) %>%
summarize(total_flights = n(),
avg_arrival_delay = mean(arr_delay),
median_arrival_delay = median(arr_delay),
percent_late_15 = mean(late_15),
.groups = "drop") %>%
arrange(percent_late_15)
origin_summary# A tibble: 3 × 5
origin total_flights avg_arrival_delay median_arrival_delay percent_late_15
<chr> <int> <dbl> <dbl> <dbl>
1 JFK 20559 -2.38 -11 0.166
2 LGA 22804 3.93 -7 0.193
3 EWR 4295 8.78 -4 0.205ggplot(origin_summary, aes(x = reorder(origin, percent_late_15), y = percent_late_15)) +
geom_col() +
scale_y_continuous(labels = percent_format()) +
labs(title = "Percent of Delta Flights Arriving More Than 15 Minutes Late",
y = "Percent")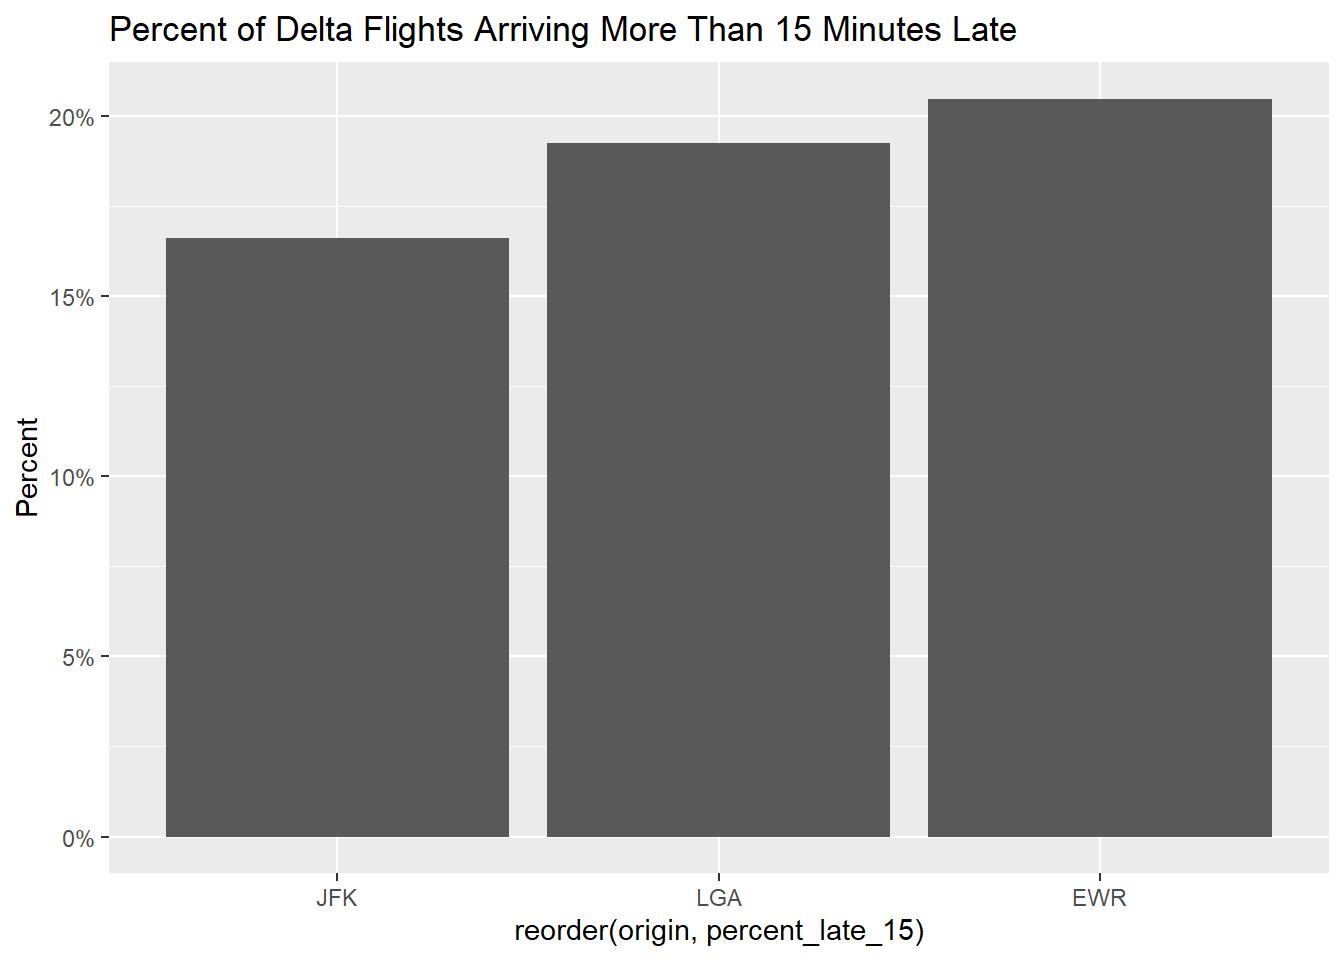
ggplot(delta_flights, aes(x = origin, y = arr_delay)) +
  geom_jitter(alpha = 0.15, width = 0.2) +
  geom_boxplot(alpha = 0.3, outlier.shape = NA) +
  coord_cartesian(ylim = c(-75, 200)) +
  labs(title = "Individual Delta Flight Arrival Delays by Origin Airport",
    y = "Delay in Minutes")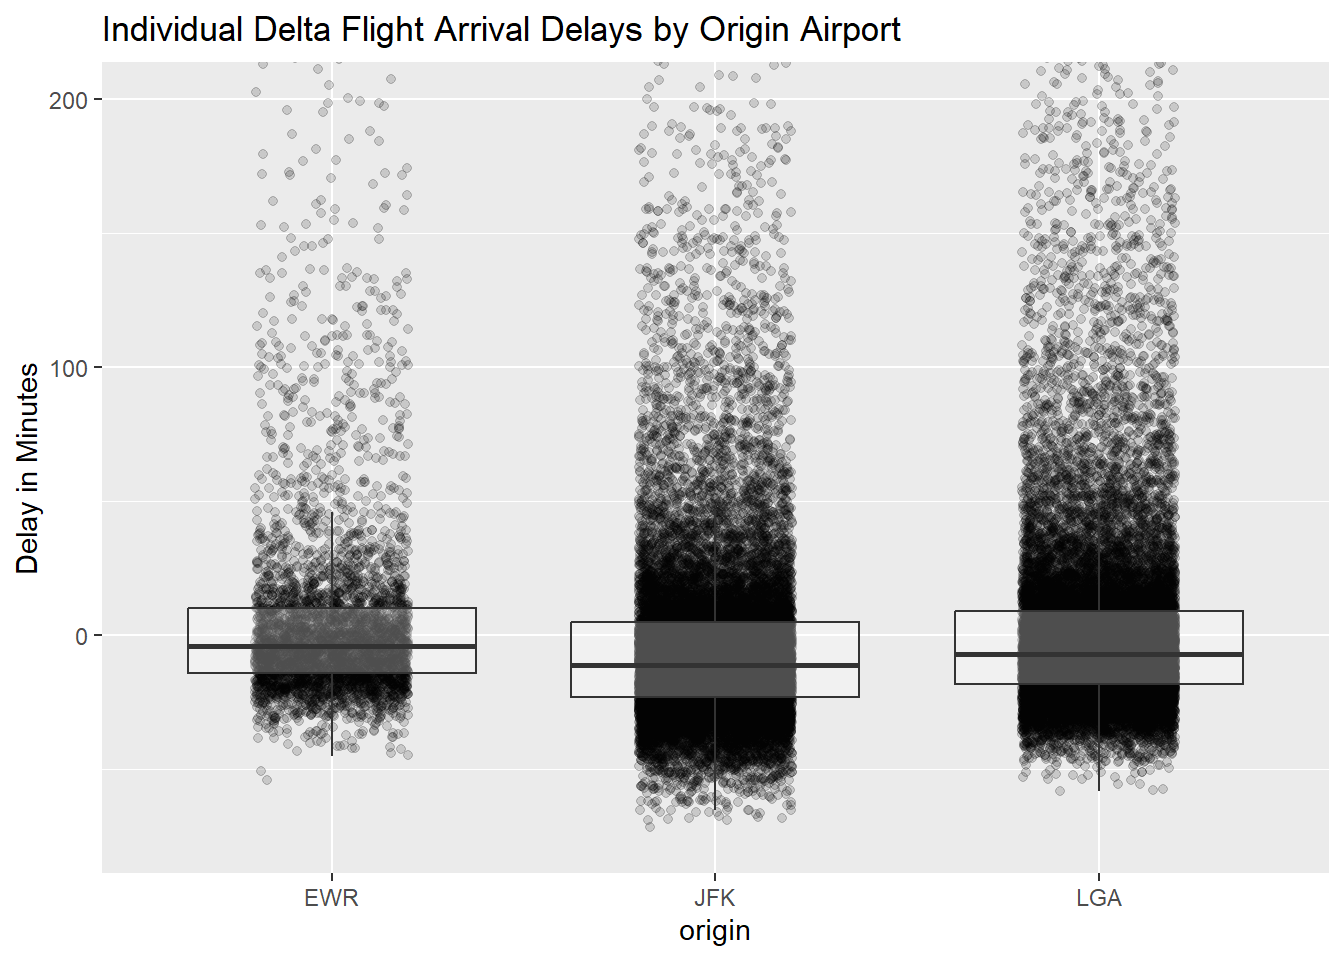
best_origin <- origin_summary %>%
  slice_min(percent_late_15, n = 1)

best_origin
# A tibble: 1 × 5
origin total_flights avg_arrival_delay median_arrival_delay percent_late_15
<chr> <int> <dbl> <dbl> <dbl>
1 JFK 20559 -2.38 -11 0.166The JFK airport has the best chance to minimize a late arrival while using Delta. On average Delta overestimates their arrival delay from JFK to anywhere so they let their passengers feel like they are getting in early. This doesn’t necessarily mean that they arrive faster but that they give a generous gap for their pilots to work with in getting from point A to point B.
Which destination airport is the worst airport for arrival delays? You decide on the metric for “worst.”
destination_summary <- delta_flights %>%
  group_by(dest) %>%
  summarize(total_flights = n(),
    avg_arrival_delay = mean(arr_delay),
    median_arrival_delay = median(arr_delay),
    percent_late_15 = mean(late_15),
    .groups = "drop") %>%
  filter(total_flights >= 30) %>%
  arrange(desc(percent_late_15))

destination_summary
# A tibble: 28 × 5
dest total_flights avg_arrival_delay median_arrival_delay percent_late_15
<chr> <int> <dbl> <dbl> <dbl>
1 SAT 302 8.08 -12 0.255
2 DEN 1036 6.01 -5 0.248
3 PDX 457 4.25 -7 0.232
4 PIT 247 5.91 -12 0.227
5 MIA 2902 2.27 -9 0.215
6 FLL 2876 2.32 -7 0.212
7 PWM 233 1.14 -13 0.210
8 ATL 10452 7.42 -4 0.202
9 PBI 1450 2.06 -7 0.190
10 AUS 352 1.41 -12 0.190
# ℹ 18 more rowsdestination_summary %>%
slice_max(percent_late_15, n = 10) %>%
ggplot(aes(x = reorder(dest, percent_late_15), y = percent_late_15)) +
geom_col() +
coord_flip() +
scale_y_continuous(labels = percent_format()) +
labs(title = "Worst Delta Destination Airports for Arrival Delays",
y = "Percent")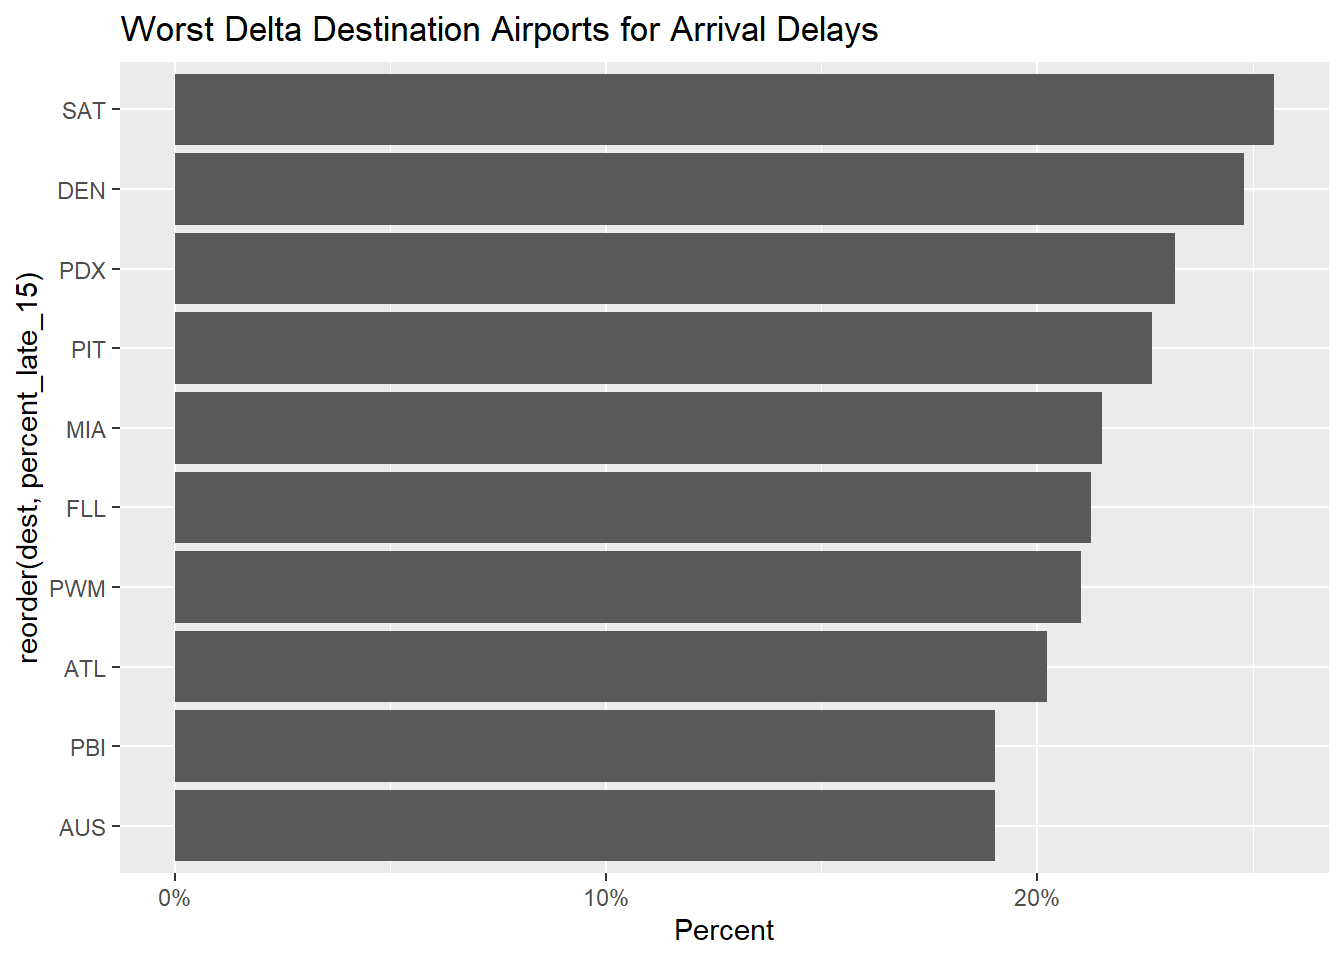
worst_destination <- destination_summary %>%
  slice_max(percent_late_15, n = 1)

worst_destination
# A tibble: 1 × 5
dest total_flights avg_arrival_delay median_arrival_delay percent_late_15
<chr> <int> <dbl> <dbl> <dbl>
1 SAT 302 8.08 -12 0.255The worst airport for arrival delays would be SAT. This is because the average arrival delay is the highest out of all of the other airports, the median delay is one of the top 3 and the percent of flights that get delayed is the highest out of all of them.