Introduction
This experiment tested whether Oreo’s dissolve faster in different liquids and temperatures. More specifically, I wanted to see whether an Oreo would dissolve faster in water or Mountain Dew and whether the temperature of the liquid would have an effect on how much of the Oreo dissolved after one minute.
In order to test this, I designed an experiment using two factors: liquid type and temperature. The liquid type had two levels, water and Mountain Dew, while temperature had two levels, hot (100°F) and cold (50°F). This gave us four different treatment combinations. The response variable was the proportion of the Oreo remaining after one minute, represented by a decimal. A smaller decimal meant that more of the Oreo had dissolved. I wanted to determine whether either factor had an effect on dissolving and whether the two factors interacted with each other.
Method
In order to conduct the experiment in a way that would help increase confidence in the results, I set several constraints.
- Each Oreo would have the white cream removed so that only the cookie was being tested.
- Each Oreo cookie top would weigh 0.2 ounces before being divided into four equal pieces.
- Each piece would be soaked for exactly one minute.
- The hot liquids would be heated to 100°F and the cold liquids cooled to 50°F, within 3 degrees of the intended temperature.
- The same two liquids, water and Mountain Dew, would be used throughout the experiment.
- Each treatment combination would be tested four times, giving us 16 observations in total.
There were also several things I did not control that may have affected the study.
- The Oreo pieces may not have been divided into perfectly equal quarters.
- The amount of Oreo remaining was estimated visually rather than measured using a precise scale.
- The temperature of the liquids may have changed during the experiment.
- The Oreo pieces from previous trials were not removed from the liquids before the next round. This may have affected how quickly the next Oreo dissolved.
- Although the cookies were the same type, individual differences in the structure of each cookie may have affected how quickly they dissolved.
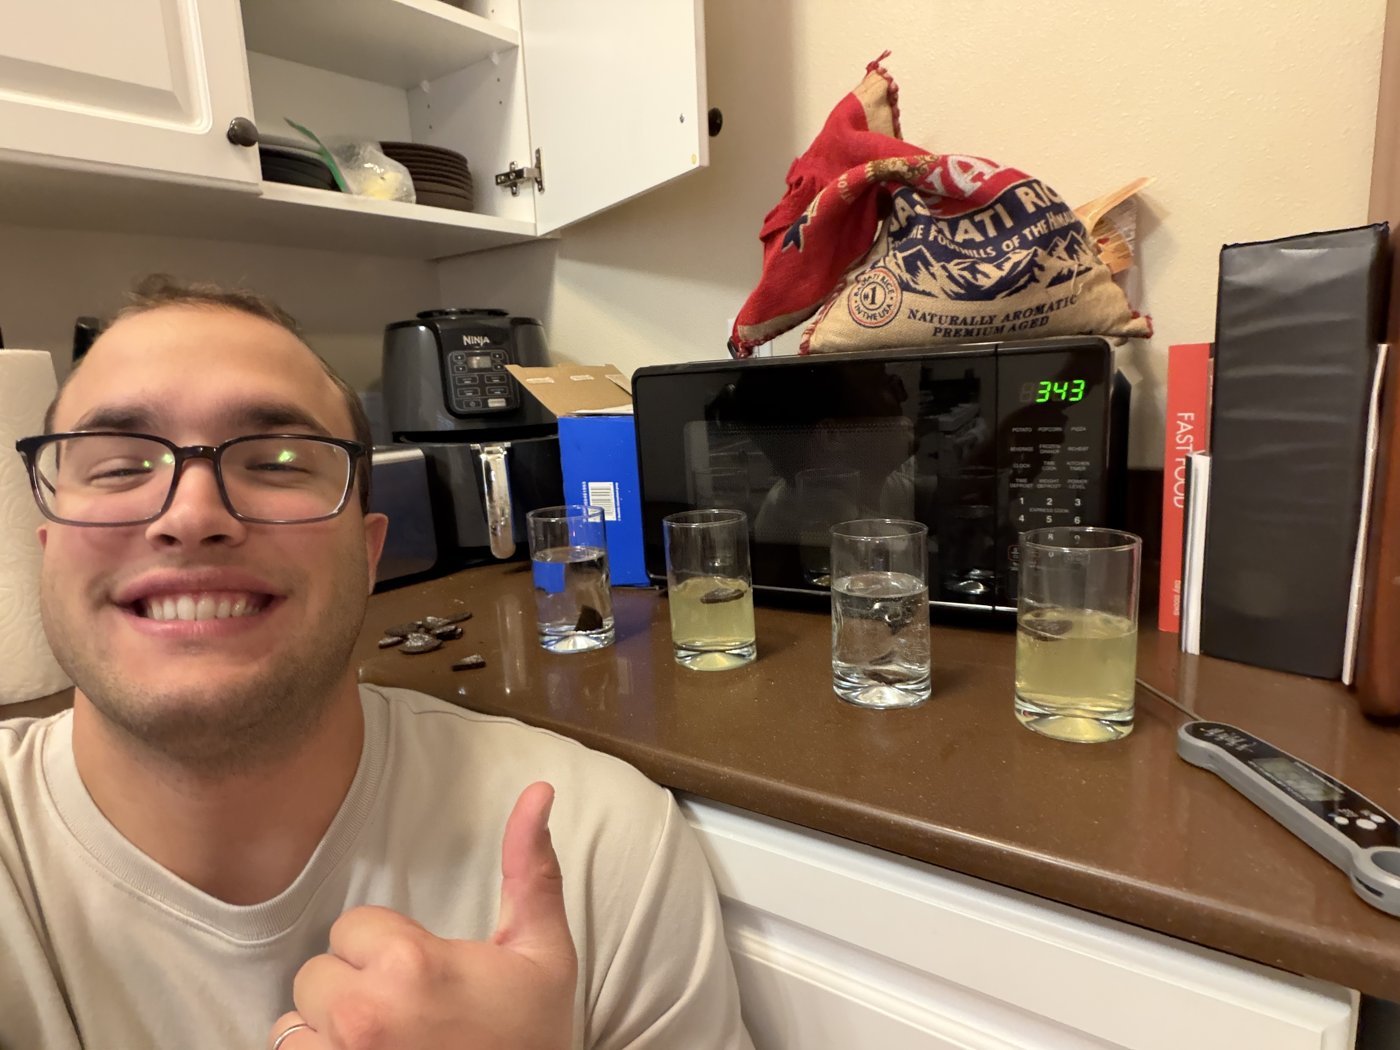
With these advantages and limitations of the study in mind, I began by taking apart four Oreo’s and scraping off the white cream filling so that only the cookie portions remained. I made sure each cookie top weighed 0.2 ounces and then divided each into four pieces by breaking it in half and then breaking each half again.
I then prepared four different solutions: hot water, cold water, hot Mountain Dew, and cold Mountain Dew. The hot solutions were heated to approximately 100°F and the cold solutions were cooled to approximately 50°F, with each solution staying within 3 degrees of its intended temperature when prepared.
Once the solutions were ready, I placed one quarter of an Oreo into each solution and allowed it to soak for one minute. After the minute had passed, I recorded the estimated proportion of the Oreo remaining as a decimal. I then repeated this process for four rounds of testing, resulting in four observations for each treatment combination.
One important limitation of the experiment was that I did not replace or clean the solutions between rounds. Instead, I allowed the remaining Oreo pieces to continue dissolving in the liquid before introducing the next pieces. This means that later observations may have been affected by Oreo material already dissolved in the solutions.
Analysis
Basic Statistics
Show the code
favstats(Degredation ~ Temp + Liquid, data = oreo) Temp.Liquid min Q1 median Q3 max mean sd n missing
1 Cold.Mountain_Dew 0.05 0.0875 0.100 0.1625 0.35 0.1500 0.1354006 4 0
2 Hot.Mountain_Dew 0.50 0.5750 0.700 0.8500 1.00 0.7250 0.2217356 4 0
3 Cold.Water 0.05 0.0875 0.150 0.2375 0.35 0.1750 0.1322876 4 0
4 Hot.Water 0.60 0.7125 0.875 1.0000 1.00 0.8375 0.1973787 4 0Show the code
boxplot(oreo$Degredation ~ Temp * Liquid, data = oreo, main = "Degredation amount of Oreos", xlab = "Degredation (%)", ylab = "Different Solutions", col = c("skyblue", "orange", "lightgreen", "red"))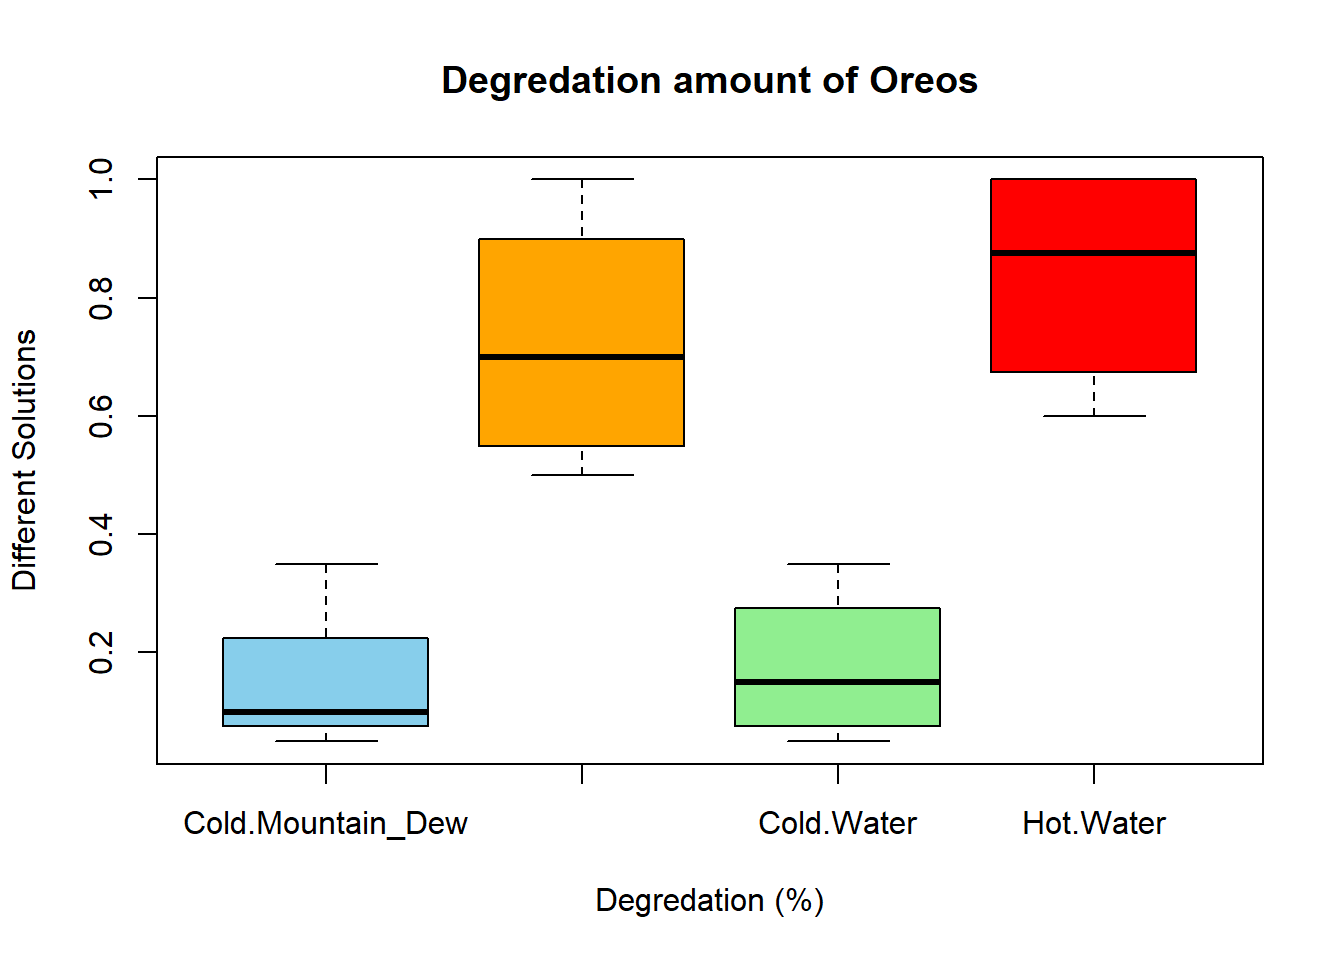
Show the code
BF2oreo <- aov(Degredation ~ Temp * Liquid, data = oreo)In order to describe the results, I compared the proportion of Oreo remaining after one minute for each of the four treatment combinations. There were 16 observations in total, with four observations for each combination of liquid and temperature. The overall average proportion of Oreo remaining was 0.47, with a standard deviation of 0.36. The smallest observed proportion remaining was 0.05 and the largest was 1.00.
The cold Mountain Dew had the lowest average proportion of Oreo remaining at 0.15, meaning that it dissolved the most Oreo during the one-minute period. The hot water had the highest average proportion remaining at 0.84 meaning that the Oreo dissolved the least in that solution.
Looking at the variation between observations, cold water had the smallest standard deviation, meaning that its results were the most consistent in this experiment. Meanwhile, hot mountain dew had the largest standard deviation, meaning that its observations varied the most between rounds.
The boxplot shows that the biggest difference in whether or not the Oreo dissolved wasn’t the type of solution but was the temperature of the solution. Although some treatments appeared to dissolve more Oreo than others, we will need to use an ANOVA to determine whether these differences provide statistically significant evidence of an effect.
Interaction Plot
Show the code
interaction.plot(oreo$Temp, oreo$Liquid, oreo$Degredation, col = c("blue", "red"), xlab = "Temperature", ylab = "Mean Proportion of Oreo Remaining", trace.label = "Liquid", main = "Interaction Between Liquid and Temperature")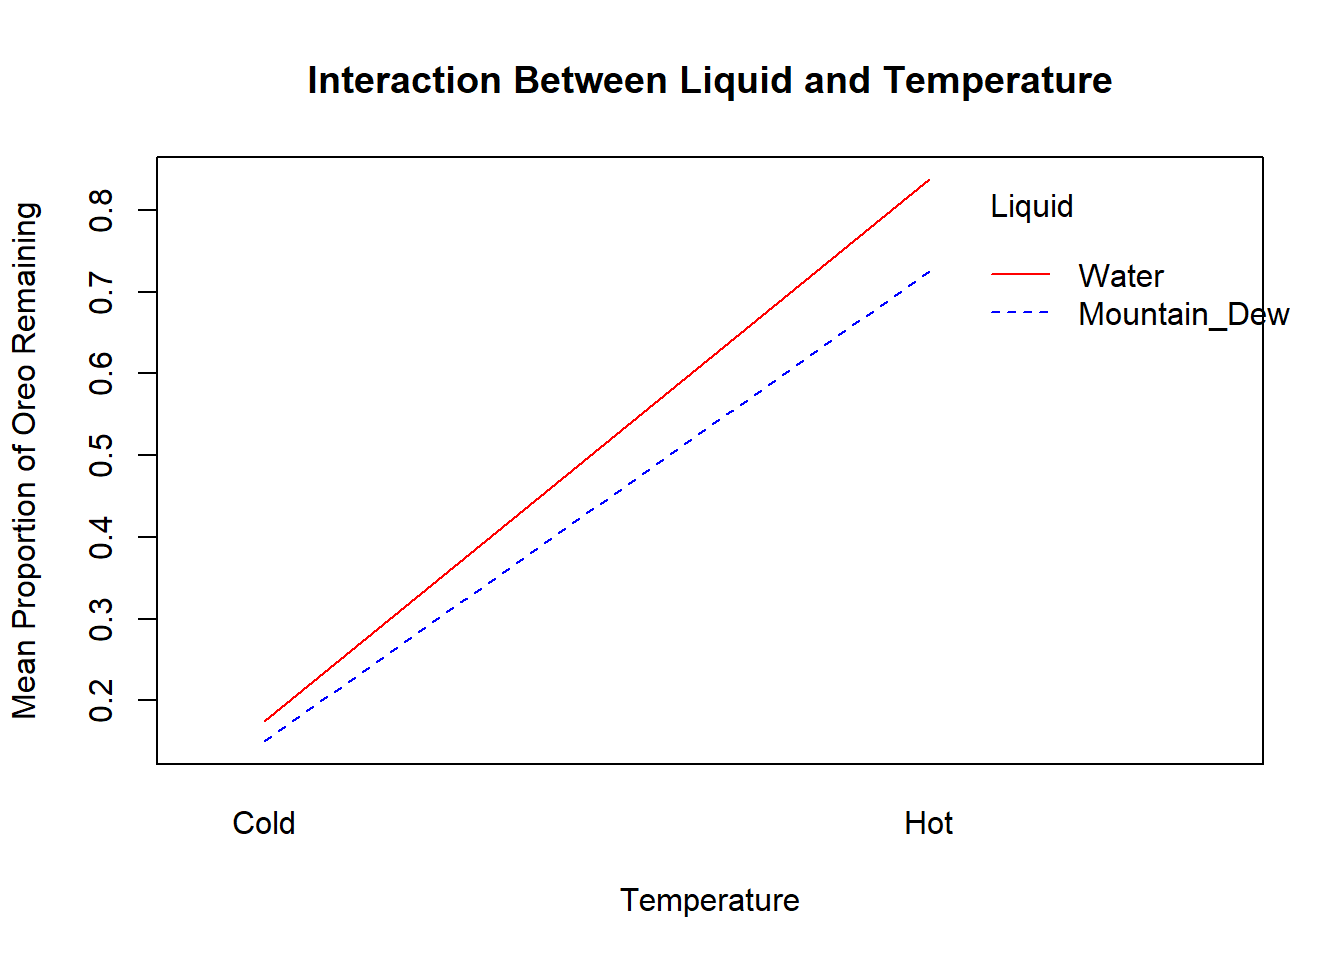
Before performing the ANOVA, I created an interaction plot to see whether the effect of temperature changed depending on the type of liquid being used. This is important because we want to determine not only whether temperature and liquid type have individual effects, but also whether they have an effect when combined.
The interaction plot shows that each has a positive slope from cold to hot and that they appear parallel. This suggests that there MAY NOT be an interaction between the two factors. However, we cannot determine whether this interaction is statistically significant from the plot alone, so we will use the ANOVA to test it.
Checking the data
Show the code
par(mfrow = c(1,3))

plot(BF2oreo, which = 1)

plot(BF2oreo, which = 2)

qqPlot(BF2oreo$residuals)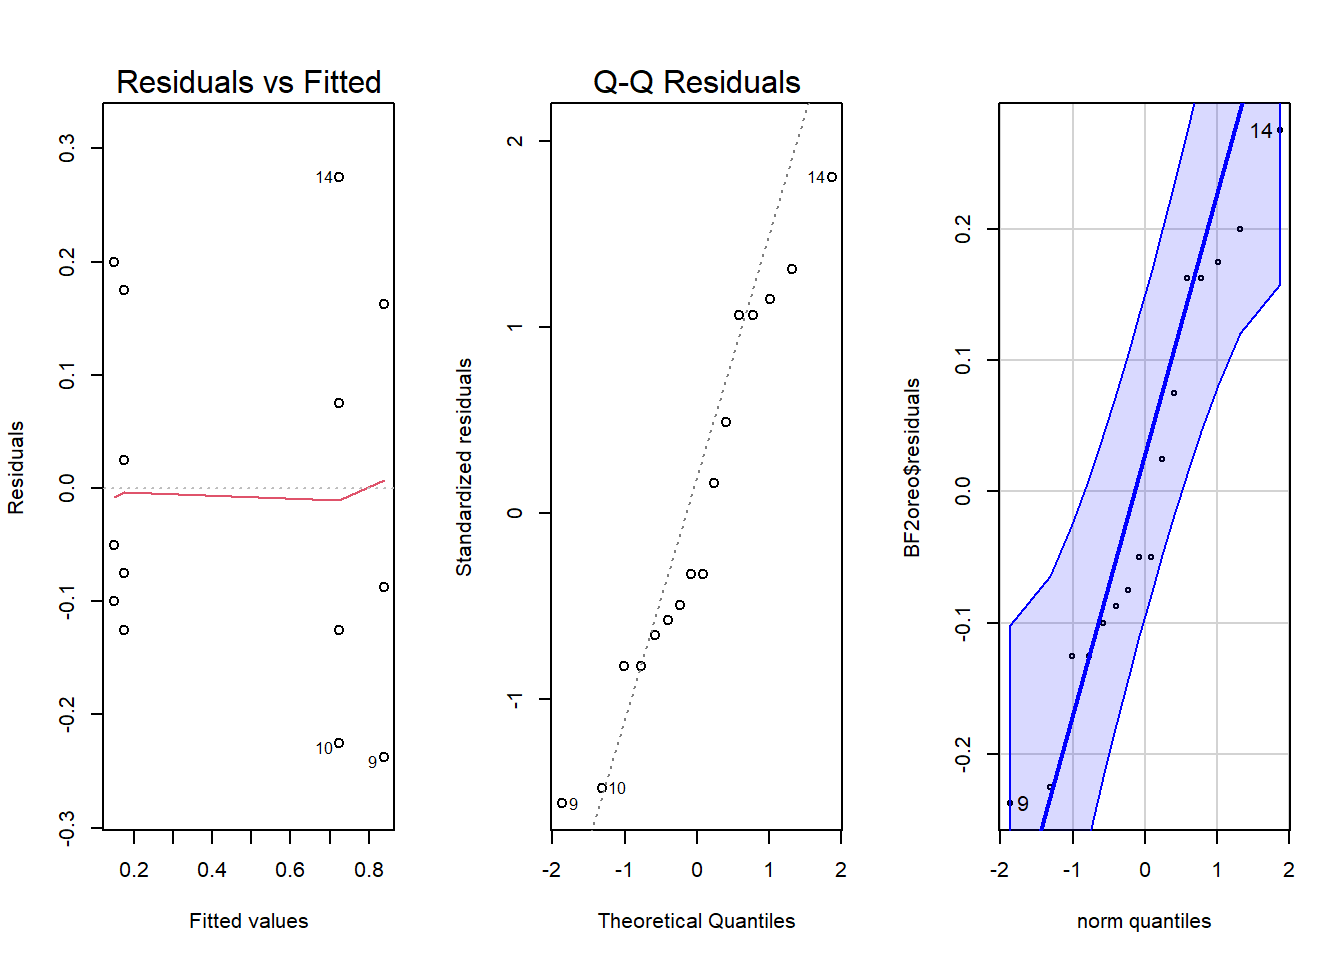
[1] 14 9Before interpreting the ANOVA, I checked the normality, variances, and residuals to determine whether the assumptions of the test were reasonable.
Looking at the residuals versus fitted values plot, our data looks to be valid because each residual is randomly placed and does not give a cone shape. The QQ plot shows that each data point follows the expected line for the residuals. I also compared the spread of the observations between the different treatment combinations and found that the data is normalize and therefor each point is valid.
Overall, the data appears to meet the assumptions of ANOVA. However, because there were only four observations per treatment combination and the remaining Oreo was measured using visual estimates, we should be cautious when interpreting the results.
Anova
Show the code
summary(BF2oreo) Df Sum Sq Mean Sq F value Pr(>F)
Temp 1 1.5314 1.5314 49.417 1.38e-05 ***
Liquid 1 0.0189 0.0189 0.610 0.450
Temp:Liquid 1 0.0077 0.0077 0.247 0.628
Residuals 12 0.3719 0.0310
---
Signif. codes: 0 '***' 0.001 '**' 0.01 '*' 0.05 '.' 0.1 ' ' 1For the two-way ANOVA, I wanted to determine whether liquid type, temperature, or the interaction between the two factors had an effect on the average proportion of Oreo remaining after one minute. I used a significance level of 0.05.
The first null hypothesis was that there was no difference in the population mean proportion of Oreo remaining between water and Mountain Dew. The second null hypothesis was that there was no difference between hot and cold temperatures. The third null hypothesis was that there was no interaction between liquid type and temperature.
Interaction Effect
The ANOVA produced a p-value of 0.628 for the interaction between liquid type and temperature. Since this value is less than 0.05, we fail to reject the null hypothesis that there is no interaction between the two factors.
This suggests that we do not have sufficient evidence to conclude that the effect of temperature differs depending on the type of liquid being used. This also tells us that a pairwise comparison would not be helpful because their is no significant interaction between the two factors
Main Effect of Liquid Type
For the liquid type, the ANOVA produced a p-value of 0.45. Since this value is less than 0.05, we again fail to reject the null hypothesis that water and Mountain Dew have the same population mean proportion of Oreo remaining.
This means that there is insufficient evidence to conclude that water and Mountain Dew produce different average proportions of Oreo remaining.
Main Effect of Temperature
For temperature, the ANOVA produced a p-value of 0.0000138. Since this value is less than 0.05, we reject the null hypothesis that hot and cold liquids have the same population mean proportion of Oreo remaining.
This provides evidence that temperature has an effect on the proportion of Oreo remaining after one minute.
Conclusion
Based on this experiment, there was insufficient evidence to conclude that liquid type and temperature affected the proportion of Oreo remaining after one minute in a solution. The ANOVA produced p-values of 0.45 for liquid type, 0.0000138 for temperature, and 0.628 for the interaction between the two factors.
In order to increase confidence in these results, a future study should include more observations and use a more precise method of measuring the Oreo remaining after one minute. One improvement would be to weigh the Oreo before and after soaking rather than estimating the proportion remaining visually. Another improvement would be to replace the liquids between each round to prevent dissolved Oreo from previous observations from affecting later trials. Maintaining consistent temperatures throughout the experiment would also help reduce variation. These changes would allow for a more controlled experiment and provide greater confidence in the results.